FIGURE SUMMARY
Title

PDGFRA is a conserved HAND2 effector during early cardiac development

Authors
Xu, Y., Gehlot, R., Capon, S.J., Albu, M., Gretz, J., Bloomekatz, J., Mattonet, K., Vucicevic, D., Talyan, S., Kikhi, K., Günther, S., Looso, M., Firulli, B.A., Sanda, M., Firulli, A.B., Lacadie, S.A., Yelon, D., Stainier, D.Y.R.
Source
Full text @ Nat Cardiovasc Res

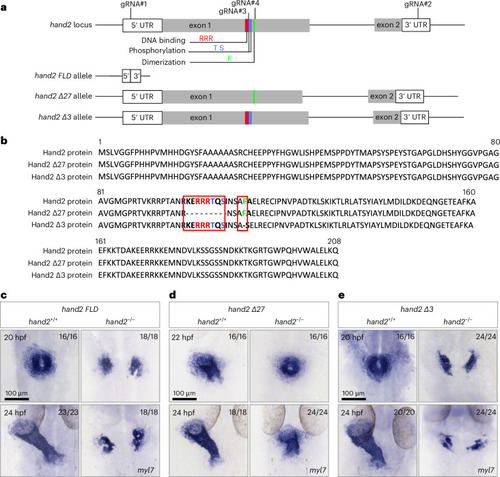
The DNA-binding domain of Hand2 is not required for early zebrafish cardiogenesis.

a, Schematic of the hand2 locus and hand2 mutants. A hand2 FLD allele was generated by targeting the 5′ and 3′ UTR sequences of hand2 (gRNA#1, gRNA#2), resulting in a deletion of 1,411 bp. A hand2 DNA-binding and phosphorylation domains-deficient allele was generated using one gRNA (gRNA#3) around the sequence encoding the DNA-binding and phosphorylation domains of Hand2, resulting in a 27-bp deletion. A hand2 dimerization domain-deficient allele was generated using one gRNA (gRNA#4) around the sequence encoding the dimerization domain of Hand2, resulting in a 3-bp deletion. b, Amino acid sequence alignment of Hand2, Hand2 Δ27 and Hand2 Δ3 generated through Clustal Omega. The three arginines in red and the threonine and serine in blue were deleted in the DNA-binding and phosphorylation domains-deficient form of Hand2 (Hand2 Δ27); the phenylalanine in green was deleted in the dimerization domain-deficient form of Hand2 (Hand2 Δ3). c, In situ hybridization showing myl7 expression in 20- and 24-hpf hand2 FLD+/+ and hand2 FLD−/− sibling embryos. d, In situ hybridization showing myl7 expression in 22- and 24-hpf hand2 Δ27+/+ and hand2 Δ27−/− sibling embryos. e, In situ hybridization showing myl7 expression in 20- and 24-hpf hand2 Δ3+/+ and hand2 Δ3−/− sibling embryos. The proportion of embryos matching the image shown is indicated in the top right corner of each image. The scale bars apply to all images.

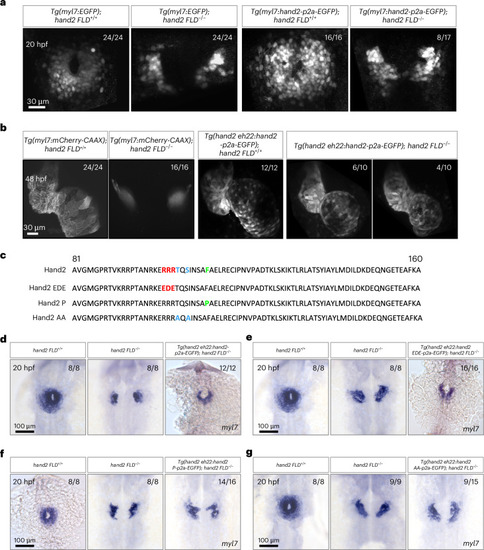
Cardiac fusion requires the dimerization domain of Hand2.

a, Maximum intensity projections of confocal images of Tg(myl7:EGFP) expression in 20 hpf hand2 FLD+/+ and hand2 FLD−/− sibling embryos, as well as Tg(myl7:hand2-p2a-EGFP) expression in 20 hpf hand2 FLD+/+ and hand2 FLD−/− sibling embryos (of the 17 Tg(myl7:hand2-p2a-EGFP); hand2 FLD−/− embryos, 9 displayed no rescue of myocardial migration and 8 displayed partial rescue). b, Maximum intensity projections of confocal images of Tg(myl7:mCherry-CAAX) expression in 48 hpf hand2 FLD+/+ and hand2 FLD−/− sibling embryos, as well as Tg(hand2 eh22:hand2-p2a-EGFP) expression in 48 hpf hand2 FLD+/+ and hand2 FLD−/− sibling embryos. c, Partial amino acid sequence alignment of Hand2, Hand2 EDE, Hand2 P and Hand2 AA. EDE: DNA-binding-deficient form of Hand2 (RRR to EDE); P: dimerization-deficient form of Hand2 (F to P); AA: phosphorylation-deficient form of Hand2 (TS to AA). d, In situ hybridization showing myl7 expression in 20 hpf hand2 FLD+/+, hand2 FLD−/− and Tg(hand2 eh22:hand2-p2a-EGFP); hand2 FLD−/− sibling embryos. e, In situ hybridization showing myl7 expression in 20 hpf hand2 FLD+/+, hand2 FLD−/− and Tg(hand2 eh22:hand2 EDE-p2a-EGFP); hand2 FLD−/− sibling embryos. f, In situ hybridization showing myl7 expression in 20 hpf hand2 FLD+/+, hand2 FLD−/− and Tg(hand2 eh22:hand2 P-p2a-EGFP); hand2 FLD−/− sibling embryos (of the 16 Tg(hand2 eh22:hand2 P-p2a-EGFP); hand2 FLD−/− embryos, 14 displayed no rescue of myocardial migration and 2 displayed WT hand2-like rescue). g, In situ hybridization showing myl7 expression in 20 hpf hand2 FLD+/+, hand2 FLD−/− and Tg(hand2 eh22:hand2 AA-p2a-EGFP); hand2 FLD−/− sibling embryos (of the 15 Tg(hand2 eh22:hand2 AA-p2a-EGFP); hand2 FLD−/− embryos, 9 displayed no rescue of myocardial migration and 6 displayed WT hand2-like rescue). All embryos are shown in dorsal views, anterior to the top. The proportion of embryos matching the image shown is indicated in the top right corner of each image. The scale bars apply to all images.

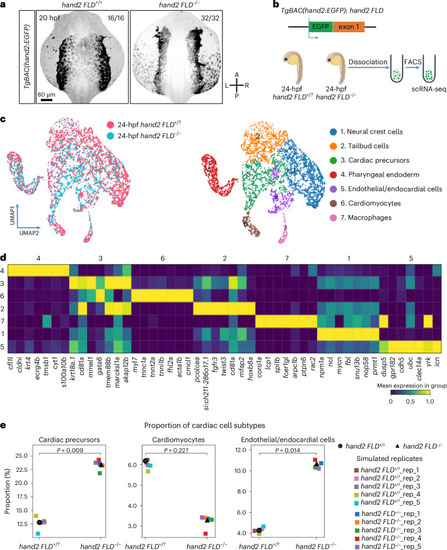
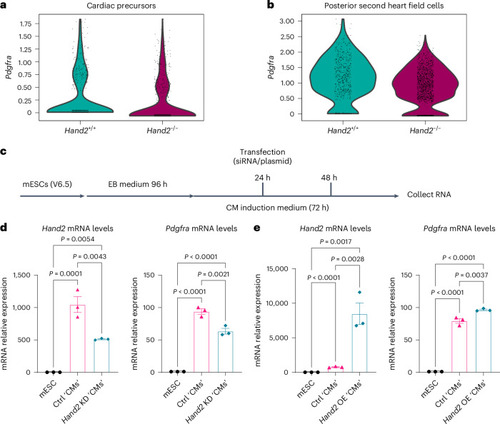
scRNA-seq analysis of
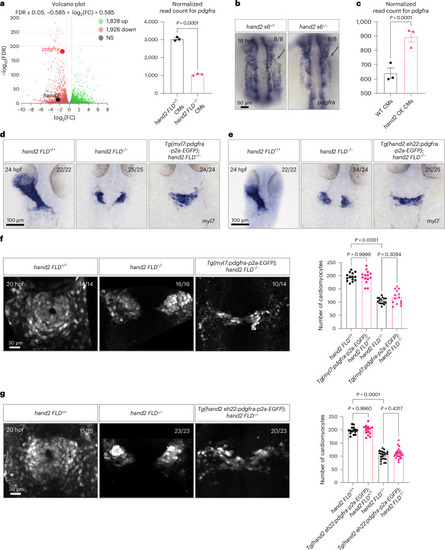
 hand2 reporter-expressing cells in WT and hand2 mutant embryos.

a, Maximum intensity projections of confocal images of 20 hpf TgBAC(hand2:EGFP) expression in hand2 FLD+/+ and hand2 FLD−/− sibling embryos. The proportion of embryos matching the image shown is indicated in the top right corner of each image. The scale bar applies to all images. b, Schematic of the experimental protocol; the transcriptomes of 3,900 and 3,836 individual hand2 reporter-expressing cells from 24 hpf hand2 FLD−/− and hand2 FLD+/? sibling embryos, respectively, were sequenced. c, Left, UMAP representation of the cells from hand2 FLD−/− (blue) and hand2 FLD+/? (pink) sibling embryos. Right, UMAP of the data clustered by the Leiden algorithm. d, Heat map of the top 7 DEGs in each cell cluster. A list of the DEGs in each cell cluster can be found in Supplementary Table 2. e, Proportional contribution of cardiac precursors, cardiomyocytes and endothelial/endocardial cells in 24 hpf hand2 FLD+/? and hand2 FLD−/− sibling embryos generated by Scanpro’s bootstrapping method. Panel b created with BioRender.com.

Hand2 regulates pdgfra expression to promote cardiac fusion.

a, Left, transcriptomic analysis was performed using RNA extracted from sorted Tg(myl7:EGFP)+ cells from 20 hpf hand2 FLD+/? and hand2 FLD−/− sibling embryos. Right, normalized read count for pdgfra in 20 hpf hand2 FLD+/? and hand2 FLD−/− sibling Tg(myl7:EGFP)+ cells; error bars are mean ± s.e.m.; n = 3 biologically independent samples. b, In situ hybridization showing pdgfra expression in the anterior LPM (arrows) of 16 hpf hand2 s6+/? and hand2 s6−/− sibling embryos. c, Normalized read count for pdgfra in 20 hpf hand2 OE and WT sibling Tg(myl7:EGFP)+ cardiomyocytes; error bars are mean ± s.e.m.; n = 3 biologically independent samples. d, In situ hybridization showing myl7 expression in 24 hpf hand2 FLD+/+, hand2 FLD−/− and Tg(myl7:pdgfra-p2a-EGFP); hand2 FLD−/− sibling embryos. e, In situ hybridization showing myl7 expression in 24 hpf hand2 FLD+/+, hand2 FLD−/− and Tg(hand2 eh22:pdgfra-p2a-EGFP); hand2 FLD−/− sibling embryos. f, Left, Tg(myl7:EGFP)+ cells in 20 hpf hand2 FLD+/+, hand2 FLD−/− and Tg(myl7:pdgfra-p2a-EGFP); hand2 FLD−/− sibling embryos (of the 14 Tg(myl7:pdgfra-p2a-EGFP); hand2 FLD−/− embryos, 10 displayed a comparable number of myl7:EGFP+ cells as hand2 FLD−/− embryos and 4 displayed a few more myl7:EGFP+ cells). Right, quantification of cardiomyocyte numbers in 20 hpf hand2 FLD+/+ (n = 14), hand2 FLD−/− (n = 16), Tg(myl7:pdgfra-p2a-EGFP); hand2 FLD+/+ (n = 16) and Tg(myl7:pdgfra-p2a-EGFP); hand2 FLD−/− (n = 14) sibling embryos; error bars are mean ± s.e.m. g, Left, Tg(myl7:EGFP)+ cells in 20 hpf hand2 FLD+/+, hand2 FLD−/− and Tg(hand2 eh22:pdgfra-p2a-EGFP); hand2 FLD−/− sibling embryos (of the 23 Tg(hand2 eh22:pdgfra-p2a-EGFP); hand2 FLD−/− embryos, 20 displayed a comparable number of myl7:EGFP+ cells as hand2 FLD−/− embryos and 3 displayed a few more myl7:EGFP+ cells). Right, quantification of cardiomyocyte numbers in 20 hpf hand2 FLD+/+ (n = 15), hand2 FLD−/− (n = 23), Tg(hand2 eh22:pdgfra-p2a-EGFP); hand2 FLD+/+ (n = 23) and Tg(hand2 eh22:pdgfra-p2a-EGFP); hand2 FLD−/− (n = 23) sibling embryos; error bars are mean ± s.e.m. P values were calculated using an unpaired Student’s t test (a (right), c) or a one-way analysis of variance (ANOVA) multiple-comparison test (f (right), g (right)). All embryos are shown in dorsal views, anterior to the top. The proportion of embryos matching the image shown is indicated in the top right corner of each image. The scale bars apply to all images. FDR, false discovery rate; FC, fold change; CMs, cardiomyocytes; NS, not significant (P > 0.05).

Deletion of a putative Hand2-binding region in a zebrafish pdgfra enhancer results in decreased pdgfra expression in the embryonic heart.

a, Illustration of the CoIP–MS experiment: 14 hpf 3×FLAG-hand2 and 3×FLAG-hand2 EDE mRNA-injected embryos were subjected to FLAG CoIP reactions, controlling for background with 3×HA-hand2 mRNA-injected embryos. The pulled complexes were subjected to MS. b, Volcano plot showing significantly enriched proteins in the FLAG CoIP–MS experiment. Significant proteins are indicated as blue (down) and red (up) dots, and nonsignificant proteins are indicated in gray. c, Protein intensity of Hand2, Tcf3a and Tcf3b in 3×HA-Hand2, 3×FLAG-Hand2 and 3×FLAG-Hand2 EDE protein complexes by MS; error bars are mean ± s.d.; n = 3 biologically independent samples. d, Genome browser view showing ATAC–seq and ChIP–seq peaks enriched in myocardial cells at the pdgfra locus. Red box: predicted Hand2-binding region. e, ATAC–seq genome tracks showing open chromatin regions at the predicted Hand2-binding region in 72 hpf WT (green) and hand2 s6−/− (magenta) cardiomyocytes. The tracks show the peak signal intensity for open chromatin regions (data analyzed from GSE120238 (ref. 55)). Red boxes: conserved E-boxes in the –12-kb pdgfra enhancer. f, Normalized read count for the open chromatin region across the predicted Hand2-binding region (from chr20: 22,476,180–22,476,620 bp) in 72 hpf WT and hand2 s6−/− cardiomyocytes (data analyzed from GSE120238 (ref. 55)); error bars are mean ± s.d.; n = 2 biologically independent samples. g, Confocal images of hearts from representative 98 hpf Tg(myl7:mCherry-CAAX) larvae not carrying (left) or carrying (right) the pdgfra enhancer:EGFP transgene; EGFP fluorescence is detectable in the heart of the representative double-transgenic larva (in cardiomyocytes (short arrows) and endocardial cells (long arrows) and in some pericardial cells (asterisks)); EGFP is shown in white, and cardiomyocyte membranes are shown in magenta (myl7:mCherry-CAAX). h, Relative mRNA levels of EGFP in 18 hpf Tg(pdgfra enhancer:EGFP); hand2 FLD/Δ3+/+ and Tg(pdgfra enhancer:EGFP); hand2 FLD/Δ3−/− sibling embryos; error bars are mean ± s.d.; n = 3 hand2 FLD/Δ3+/+ and n = 4 hand2 FLD/Δ3−/−. i, Left, schematic of the strategy to generate Hand2-binding pdgfra enhancer crispant embryos. Right, relative mRNA levels of pdgfra in the hearts of GFP crispant and Hand2-binding pdgfra enhancer crispant embryos at 24 hpf. P values were calculated using a one-way ANOVA multiple-comparison test (c) or an unpaired Student’s t test (h, i (right)); error bars are mean ± s.d.; n = 4 biologically independent samples. The proportion of larvae matching the image shown is indicated in the top right corner of each image. The scale bar applies to all images. Ct values of qPCR data are listed in Supplementary Table 1.

Hand2 promotes Pdgfra expression in mouse cardiac cells.

a, Violin plots showing Pdgfra expression in cardiac precursors of E8.25 WT and Hand2−/− mutant hearts (data analyzed from GSE126128 (ref. 56)). b, Violin plots showing Pdgfra expression in posterior second heart field cells of E8.25 WT and Hand2−/− mutant hearts (data analyzed from GSE126128 (ref. 56)). c, Schematic of knockdown and overexpression of Hand2 during mESC differentiation into cardiac cells. d, Relative mRNA levels of Hand2 and Pdgfra in Hand2 knockdown mESC-derived cardiac cells; error bars are mean ± s.e.m.; n = 3 biologically independent samples. e, Relative mRNA levels of Hand2 and Pdgfra in Hand2 OE mESC-derived cardiac cells; error bars are mean ± s.e.m.; n = 3 biologically independent samples. P values in d and e were calculated using a one-way ANOVA multiple-comparison test. The average mRNA level in mESCs was set at 1.0. The Ct values of qPCR data are listed in Supplementary Table 1. Ctrl, control; KD, knockdown.

Acknowledgments
This image is the copyrighted work of the attributed author or publisher, and ZFIN has permission only to display this image to its users. Additional permissions should be obtained from the applicable author or publisher of the image. Full text @ Nat Cardiovasc Res