FIGURE SUMMARY
Title

The role of ATP-binding Cassette subfamily B member 6 in the inner ear

Authors
Baril, S.A., Wilson, K.A., Shaik, M.M., Fukuda, Y., Umans, R.A., Barbieri, A., Lynch, J., Gose, T., Myasnikov, A., Oldham, M.L., Wang, Y., Zhu, J., Fang, J., Zuo, J., Kalathur, R.C., Ford, R.C., Coffin, A., Taylor, M.R., O'Mara, M.L., Schuetz, J.D.
Source
Full text @ Nat. Commun.

ABCB6 variants identified in Dyschromatosis Universalis Hereditaria (DUH).

a DUH mutations occur in highly conserved regions of ABCB6, as shown in alignments with Pan troglodytes (chimpanzee, 99.5% identity), Mus musculus (mouse, 89.0% identity), and Danio rerio (zebrafish, 63.6% identity). All percent identities are compared to the human ABCB6. b Western blot shows most DUH mutations express similarly to ABCB6 WT (representative data shown). c Band signals from (b) and replicates show statistically significant reduction in expression level of S170G, S322R, and L356P (p = 0.020, < 0.0001, and < 0.0001, respectively, from unpaired two-tailed Welch’s T-test compared to ABCB6 WT). Data reported as mean ± SEM, N = 5 biological replicates. Western blots show DUH mutants bind ATP-agarose (d) and hemin-agarose (e) comparably to ABCB6 WT. f Quantitation of Western blot signals from ATP- and hemin-agarose pulldowns (d, e) and replicates show DUH mutants bind ATP-agarose and hemin-agarose comparably to ABCB6 WT. Percent of WT binding was calculated as described in Supplementary Methods. No signal of L356P could be detected in the ATP-agarose eluted fraction (d), but a faint band could be detected from the hemin-agarose elution fraction (e). No difference compared to ABCB6 WT was found by unpaired two-tailed Welch’s T-test for any of the mutants binding to hemin-agarose. L356P showed a statistically significant decrease in ATP-agarose binding (p = 0.0004). Data are reported as mean ± SEM. ATP agarose N = 3 biological replicates, hemin agarose N = 4 biological replicates. Each biological replicate was repeated from transfection to western blot. Source data are provided in the Source Data file.

Characterization of the L356P mutation.

a Western blot shows L356P is disproportionately stabilized by 4-phenylbutyrate (4-PBA) compared to ABCB6 WT. MG132 and chloroquine (CQ) also show a less significant effect on expression (representative data shown). b Band signals from (a) and replicates were quantitated and the percentage of untreated signal was calculated (see Supplementary Methods). ABCB6 WT is shown in indigo, L356P is shown in magenta. Analysis using an unpaired two-tailed Welch’s T-test and found no significant differences between ABCB6 WT and L356P except for with 4-PBA treatment (p = 0.00262, N = 3 biological replicates per treatment.) Data are reported as mean ± SEM. c L356P (magenta) has significantly decreased ATPase activity compared to ABCB6 WT (indigo). The catalytically inactive E752Q mutant is shown in grey. Data are reported as mean ± SEM, N = 15 experiments for ABCB6 WT from five biological replicates, N = 8 experiments for E752Q from three biological replicates, and N = 4 for L356P from two biological replicates. d Western blot of isothermal shift assay shows L356P exhibits little thermal stabilization with AMP-PNP treatment, suggesting L356P cannot interact with ATP (representative data shown). e Band signals from (d) and replicates were quantitated. Data are reported as mean ± SEM. N = 3 technical replicates for ABCB6 WT (indigo) and L356P (magenta). f Cryo-EM structure of ABCB6 WT (EMDB ID: EMD-46724, PDB ID: 9DBQ) and resulting cartoon model (g). Nucleotide binding domains (NBDs) are shown in darker tones while transmembrane domains (TMDs) are colored in lighter tones. L356 (orange) is located near the coupling helix of ABCB6 (inset). Predominant conformations of ABCB6 WT (h) and L356P (i) over the combined 1500 ns of MD simulation as selected from hierarchical agglomerative clustering analysis (j) Overlay of ABCB6 WT (purple) and L356P (pink) showing the change in conformation of the coupling helix. A single chain of the homodimer has been shown for clarity, however similar changes are observed in both monomers. Overlay of ATP from ABCB10 (PDB ID: 4AYT) onto ABCB6 WT (k) or L356P (l) showing the change in conformation of the ATP binding site. Source data are provided in the Source Data file.

Characterization of zebrafish ABCB6 (Abcb6).

a Alignment of homologous ABCB6 sequences shows zebrafish Abcb6 lacks the N-linked glycosylation site89. b Western blot of samples from PNGase F treatment confirms that zebrafish Abcb6 is not a glycoprotein, unlike its human homolog (N = 1 as experiment is a qualitative confirmation of sequencing data). Western blots show zebrafish Abcb6 binds ATP-agarose (c) and various porphyrins like its human homolog (d). Representative data shown, N = 3 biological replicates for each pulldown, with each experiment repeated from transfection to western blot. e Overlay of a representative structure from the MD simulations of the zebrafish Abcb6 (green) and ABCB6 WT (indigo/turquoise as shown in Fig. 2) showing that the two proteins adopt a similar conformation. f Overlay of zebrafish Abcb6 WT and zebrafish Abcb6 L356P showing the change in conformation of the coupling helix. Source data are provided in the Source Data file.

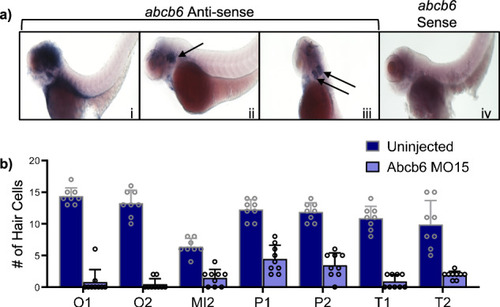
Zebrafish abcb6 knockdown affects lateral line development in zebrafish.

a Whole mount in situ hybridization (WISH) of 3 dpf AB zebrafish shows Abcb6 expression in the inner ear when treated with a zebrafish abcb6 anti-sense mRNA probe (i-iii). The auditory vesicle is denoted with black arrows. Zebrafish Abcb6 expression is not detected with a zebrafish abcb6 sense mRNA probe (iv). b Zebrafish Abcb6 MO15 morphants (purple) developed a reduced number of hair cells compared to WT (indigo) in zebrafish neuromasts. Data were analyzed by 2-way ANOVA with genotype and neuromast as factors. There is a significant main effect of genotype (F1,111 = 126.6, p < 0.0001) and neuromast (F6,111 = 6.13, p < 0.0001). O1, O2, and MI2 neuromasts are found on the head, P1 and P2 represent the first two neuromasts of the posterior lateral line (trunk), and T1 and T2 are the two terminal-most neuromasts on the tail (neuromast nomenclature modified from Raible and Kruse, 2000)90. Hair cell counts are from 3 dpf brn3c transgenic larvae, N = 8 fish for uninjected, N = 9 fish for Abcb6 MO15, bars represent mean + 1 SEM. The person counting hair cells was blinded to treatment. Experiment was repeated and the results showed the same pattern. Source data from (b) are provided in the Source Data file.

EXPRESSION / LABELING:
Gene:
Fish:
Anatomical Term:
Stage: Protruding-mouth
PHENOTYPE:
Fish:
Knockdown Reagent:
Observed In:
Stage: Protruding-mouth

Zebrafish Abcb6 MO15 morpholino affects otolith development in zebrafish.

a Zebrafish Abcb6 MO15 disrupts formation of the utricular otolith (black arrow), while uninjected controls retain both utricular (black arrow) and saccular (white arrow) otoliths at 1-, 5-, and 14-days post-fertilization (dpf). b Uninjected wild-type fish with AB (i) and p53-null (iii) backgrounds develop normal otoliths, while Abcb6 morphants (ii and iv) fail to develop the utricular otolith. c The single otolith phenotype can be rescued by co-injection with human ABCB6 mRNA. Data for uninjected control (N = 25 fish), zebrafish abcb6 mRNA (N = 9 fish), Abcb6 MO15 (N = 20 fish), and Abcb6 MO15 + human ABCB6 mRNA (N = 19 fish) can be found in Supplementary Table 4 or the source data file. Injections were repeated and the results showed the same pattern.

Zebrafish Abcb6 MO15 morphants show altered behavior compared to uninjected zebrafish.

Zebrafish movement paths overlaid with last video frame shows uninjected zebrafish swim smoothly in the upper 2/3 of the tank (a), while the zebrafish Abcb6 MO15 morphants swim erratically and spend a significant amount of time in the lower third of the tank (b). Abcb6 MO15 morphants (purple) swam further with each video frame (c), p = < 0.0001, and swam farther from their starting position (d), p = 0.013, than the uninjected controls (indigo). Abcb6 MO15 morphants also swam longer routes than their uninjected counterparts (e), p = 0.0176, and spent a significantly higher percentage of time in the bottom of their tank (39.9%) compared to the uninjected control (1.2%) (f), p = < 0.0001). Although there was no significant difference in total horizontal distance traveled (g) p = 0.0785, Abcb6 MO15 morphants traveled a greater vertical distance (160.7 pixels) than their uninjected controls (79.7 pixels, (h), p = 0.0041. * = p < 0.05, ** = p < 0.01, **** = p < 0.0001, ns = not significant by unpaired two-tailed Welch’s T-test compared to uninjected control. Data from 21 dpf AB zebrafish, N = 18 fish for uninjected, N = 25 fish for Abcb6 MO15. Median is shown as a dashed line and upper and lower quartiles are shown as dotted lines. Source data are provided in the Source Data file.

PHENOTYPE:
Fish:
Knockdown Reagent:
Observed In:
Stage: Days 21-29

ABCB6 plays a role in the murine inner ear.

a mRNA counts of mouse Abcb6 increase with cochlear development (white), but not utricular development (black). Data taken from the SHIELD database45. b 5–6-week-old Abcb6 knockout (KO) mice (purple) exhibit a frequency-independent increase in auditory brainstem response (ABR) compared to the wild-type control (indigo). Data are reported as mean ± SEM. N = 5 mice for WT Control (C57/129 mix) and N = 6 mice for Abcb6 KO. Source data are provided in the Source Data file.

ZFIN is incorporating published figure images and captions as part of an ongoing project. Figures from some publications have not yet been curated, or are not available for display because of copyright restrictions.

Acknowledgments
This image is the copyrighted work of the attributed author or publisher, and ZFIN has permission only to display this image to its users. Additional permissions should be obtained from the applicable author or publisher of the image. Full text @ Nat. Commun.