FIGURE SUMMARY
Title

Heat-inactivated Streptococcus pneumoniae augments circadian clock gene expression in zebrafish cells

Authors
Morales Fénero, C., Sacksteder, R.E., Diamos, A.G., Kimmey, J.M.
Source
Full text @ Sci. Rep.

Effect of light exposure in the expression of per2, cry1a, per3, and per1b on Z3 cells. (a) Z3 cells were entrained for three LD cycles of 12:12 h. After the third day of entrainment, cells were exposed to constant darkness (DDDD) and mRNA expression of the genes per2, cry1a, per3, and per1b were analyzed every 4 h for 48 h. The eJTK test detected circadian rhythmicity on per3 and per1b, with a p-value of 0.01. No rhythmicity was detected in per2 and cry1a in DDDD. (b) mRNA expression of the genes per2, cry1a, per3 and per1b after a 12-hour exposure of low-intensity light (~ 4.12 × 1018 photons/s/m2) with subsequent darkness (LDDD). Samples were taken every 4 h for 48 h. Transcript levels were measured against time zero. Yellow bar: light exposure. Grey bar: constant darkness. Means ± SD are shown. Three replicates per group, one experiment.

HK-Spn exposure augments the expression of per2, cry1a, per3, and per1b on zebrafish cells. (a) After entrainment, Z3 cells were exposed to PBS or heat-killed Streptococcus pneumoniae (HK-Spn) and maintained in constant darkness (DDDD). RNA samples were collected every 4 h throughout 48 h, and the relative transcript expression of per2, cry1a, per3, and per1b was measured. (b) Z3 cells were exposed to PBS or heat-killed Streptococcus pneumoniae (HK-Spn) under 12-hour low-intensity light (~ 4.12 × 1018 photons/s/m2) followed by constant darkness (LDDD). RNA samples were collected every 4 h throughout 48 h, and the relative transcript expression of per2, cry1a, per3, and per1b was measured. All time points were compared against time zero samples. Yellow bar: light period. Grey bar: dark period. Means ± SD are shown. Asterisks (*) indicate statistically significant differences *p < 0.05,** p < 0.01,***p < 0.001, ****p < 0.0001, Two-way ANOVA with Šídák’s multiple comparisons test. Three replicates per group, one experiment.

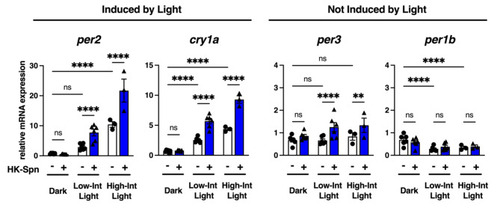
Light intensity proportionally augments HK-Spn effect on per2 and cry1a but not in per3 and per1b. Z3 cells were entrained and exposed to HK-Spn under two light conditions, low-intensity light (Low-Int light,~4.12 × 1018 photons/s/m2) and high-intensity light (High-Int light, ~ 3.96 × 1019 photons/s/m2) for 4 h. Transcript expression of per2, cry1a, per3, and per1b was compared against time zero samples. Means ± SEM are shown. Asterisks (*) indicate statistically significant differences ** p < 0.01,****p < 0.0001, Two-way ANOVA with Tukey’s multiple comparisons test. Six experiments were conducted for dark and low-intensity light conditions, and three were conducted for high-intensity light conditions. Three replicates per group.

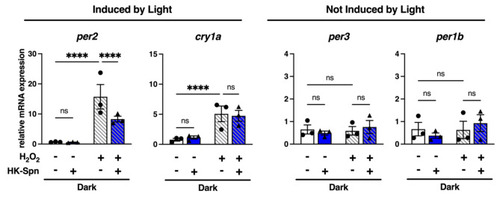
Hydrogen peroxide does not replicate light and HK-Spn effects. Relative expression of per2, cry1a, per3, and per1b in Z3 cells incubated with 300 µM hydrogen peroxide (H2O2) and HK-Spn for 4 h in the dark. Means ± SEM are shown. Asterisks (*) indicate statistically significant differences ****p < 0.0001, Two-way ANOVA with Tukey’s multiple comparisons test. Three experiments with three replicates per group.

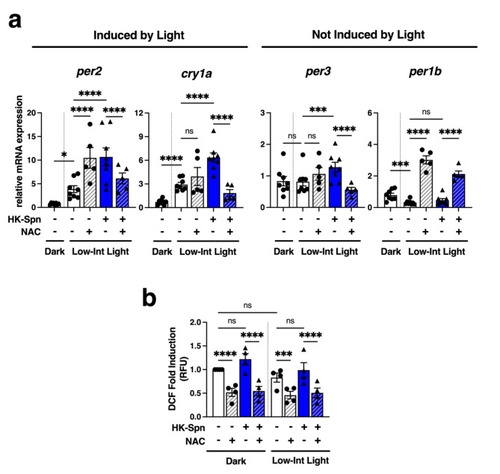
Role of ROS in HK-Spn and light induction of clock genes. (a) Relative expression of per2, cry1a, per3, and per1b of Z3 cells exposed to HK-Spn and incubated in dark and low-intensity light conditions for 4 h. A 2-hour pre-treatment of 6 mM of N-acetyl cysteine (NAC) was used to suppress ROS production. Means ± SEM are shown. Asterisks (*) indicate statistically significant differences *p < 0.05, ***p < 0.001, ****p < 0.0001, Two-way ANOVA with Tukey’s multiple comparisons. Five to eight experiments, three replicates per group. (b) Dichlorodihydrofluorescein (DCF) fluorescence was measured after 2 h of PBS or HK-Spn exposure in dark and low-intensity light conditions. A 2-hour pre-treatment of 6 mM of N-acetyl cysteine (NAC) was used to suppress ROS production. Fold induction of relative fluorescent units was calculated against the dark PBS-treated cells. Means ± SEM are shown. Asterisks (*) indicate statistically significant differences ***p < 0.001,****p < 0.0001, Two-way ANOVA with Tukey’s multiple comparisons test. Four experiments, three replicates per group.

Acknowledgments
This image is the copyrighted work of the attributed author or publisher, and ZFIN has permission only to display this image to its users. Additional permissions should be obtained from the applicable author or publisher of the image. Full text @ Sci. Rep.