
- Title
-
Celsr3 drives development and connectivity of the acoustic startle hindbrain circuit
- Authors
- Meserve, J.H., Navarro, M.F., Ortiz, E.A., Granato, M.
- Source
- Full text @ PLoS Genet.

Celsr3 is required for directionally unbiased acoustic startle escapes. A) Schematic of a 5 dpf (days post-fertilization) larva (dorsal view) with a simplified diagram of the hindbrain circuit that drives the acoustic startle fast escape. +/- symbols indicate excitatory/inhibitory synapses. Dotted line indicates unknown connection. In response to a startling acoustic stimulus, Mauthner firing results in direct activation of contralateral motor neurons, leading to unilateral muscle contraction and a sharp turn (C1-bend). An iteration of this circuit model was previously used by the authors [ |

Celsr3 is required for Mauthner development. A,B) |

Celsr3 is required for spiral fiber axon guidance and glial localization to the axon cap. A) The axon cap (dotted red box in circuit diagram) is comprised of excitatory spiral fiber axons (blue) and feedback inhibitory axons (pink) synapsing with the Mauthner (green) axon initial segment (AIS), surrounded by astrocyte-like glia (dotted line). B-E) A wild type larva with |

Asymmetric spiral fiber input to Mauthner neurons in A-D) Region of hindbrain with Mauthner and spiral fiber neurons from 5 dpf |

A-F) |
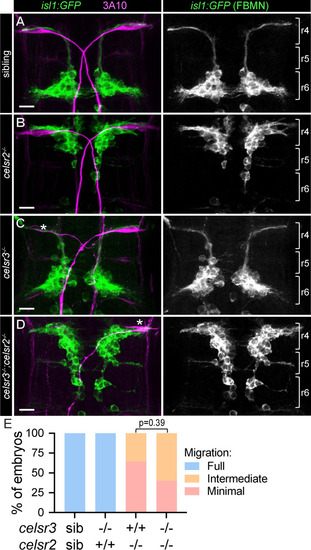
FBMN migration is independent of A-D) |

|
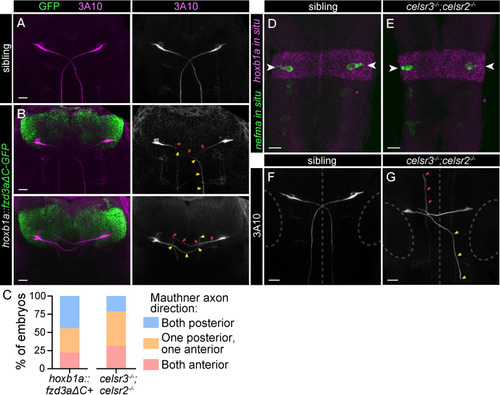
The PCP pathway directs A-P axon guidance of Mauthner cells. A-B) Wild type hindbrain with α-3A10 labeling Mauthner somas and axons. Mauthner axons grow posteriorly, towards the bottom of the image. All images and quantification in figure are from 30 hpf embryos. B) Two representative examples of |