FIGURE SUMMARY
Title

Altechromone A Ameliorates Inflammatory Bowel Disease by Inhibiting NF-κB and NLRP3 Pathways

Authors
Li, L., Huang, J., Feng, L., Xu, L., Lin, H., Liu, K., Li, X., Wang, R.
Source
Full text @ Mar. Drugs

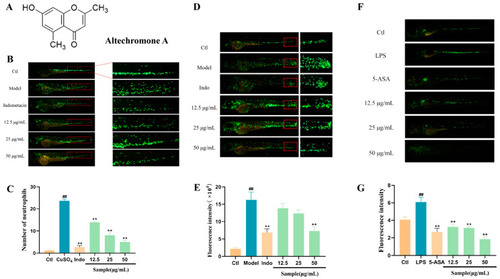
Anti-inflammatory effect of Altechromone A. The results were subjected to analysis using one-way analysis of variance followed by Dunnett’s post hoc t-test. ## p ≤ 0.01 vs. Ctl, ** p ≤ 0.01 vs. model. (A) Chemical structure of Altechromone A. (B) Effect of Altechromone A on number of neutrophils in CuSO4-induced acute inflammation model. (C) Images of migration and aggregation of neutrophils, suggested by GFP. The migrated cells were explored in red area. The bar graph counts the number of migrating and aggregated neutrophils. (D) Effect of Altechromone A on the fluorescence intensity of neutrophils in tail amputation model. (E) Images of migration and aggregation of neutrophils, suggested by GFP. The migrated cells were explored in red area. The bar graph counts the fluorescence intensity (RFU) for migrating and aggregated neutrophils. (F) Effect of Altechromone A on the fluorescence intensity of neutrophils in LPS-induced systemic inflammation model. (G) Images of migration and aggregation of neutrophils, indicated by GFP. The bar graph counts the fluorescence intensity (RFU) for migrating and aggregated neutrophils.

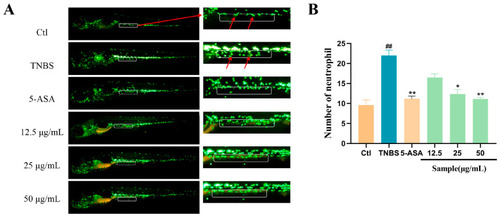
Effect of Altechromone A on the quantity of neutrophils in TNBS-induced IBD model. (A) Images of migration and aggregation of leukocytes, suggested by GFP. The migrated cells were explored in white area. (B) The quantity of migrating and aggregating leukocytes. The results were subjected to analysis using one-way analysis of variance followed by Dunnett’s post hoc t-test. ## p ≤ 0.01 vs. Ctl, * p ≤ 0.05 vs. model, ** p ≤ 0.01 vs. model.

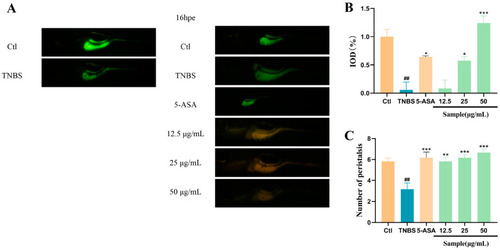
Effect of Altechromone A on intestinal peristalsis and efflux performance in TNBS-induced IBD model. (A) Zebrafish was immersed in calcein solution for 10 min, and fluorescent images were photographed at 0 h and 16 h after excretion (16 hpe). (B) Quantitation of integrated optical density parameter of the intestinal region. (C) Frequency of peristalsis in the intestine after staining. The results were subjected to analysis using one-way analysis of variance followed by Dunnett’s post hoc t-test. ## p ≤ 0.01 vs. Ctl, * p ≤ 0.05 vs. model, ** p ≤ 0.01 vs. Model, *** p ≤ 0.001 vs. Model.

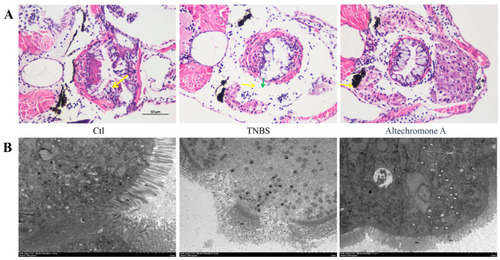
Effect of Altechromone A on intestinal structure in TNBS-induced IBD models. (A) Representative H&E-stained cross-sections; the yellow arrow display the goblet cells and the green arrow is the secretion of goblet cells. (B) The transmission electron microscope photographs. The results were subjected to analysis using one-way analysis of variance followed by Dunnett’s post hoc t-test. Arrows indicate that the rough endoplasmic reticulum (rER) was not significantly expanded, and the ribosomes attached to its surface did not detach.

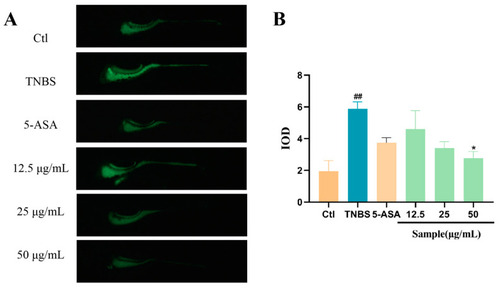
Effect of Altechromone A on content of ROS in TNBS-induced IBD model. (A) Images stained with ROS. (B) Quantitation of integrated optical density (IOD) parameter of ROS. The results were subjected to analysis using one-way analysis of variance followed by Dunnett’s post hoc t-test. ## p ≤ 0.01 vs. Ctl, * p ≤ 0.05 vs. model.

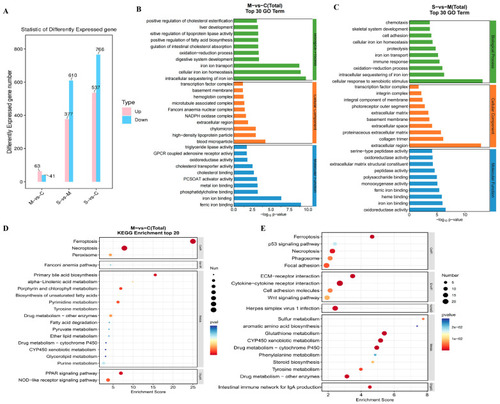
Effect of Altechromone A on transcriptome analysis in TNBS-induced IBD models. (A) The histogram of differentially expressed genes. (B,C) show GO analysis of DEGs of TNBS-induced IBD model and Altechromone A treatment. Green, orange, and blue diagrams showing biological processes, cellular components, and molecular functions. (D,E) show KEGG enrichment diagram of DEGs of TNBS-induced IBD model and Altechromone A treatment.

Gene mRNA expression degrees in zebrafish after Altechromone A treatment. The results were subjected to analysis using one-way analysis of variance followed by Dunnett’s post hoc t-test. ## p ≤ 0.01 vs. Ctl, * p ≤ 0.05 vs. model, ** p ≤ 0.01 vs. Model, *** p ≤ 0.01 vs. model.

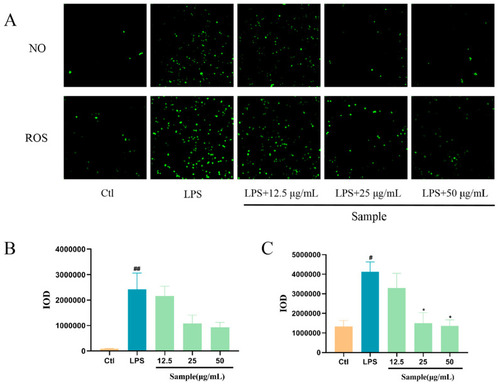
Effect of Altechromone A on NO and ROS levels in LPS-induced RAW264.7 cell model. ## p < 0.01 vs. Ctl. (A) NO and ROS cell staining images. (B) Quantification of the integral optical density (IOD) parameter of NO. (C) Quantification of integrated optical density (IOD) parameters for ROS. The results were subjected to analysis using one-way analysis of variance followed by Dunnett’s post hoc t-test. # p ≤ 0.05 vs. Ctl, ## p ≤ 0.01 vs. Ctl, * p ≤ 0.05 vs. model.

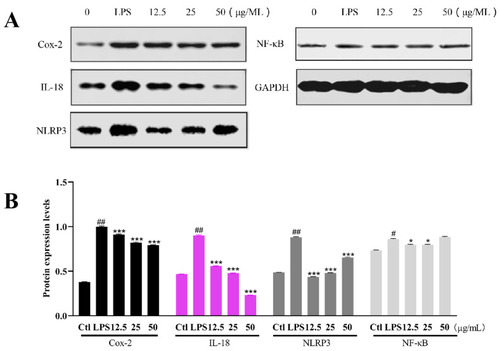
The protein expression level in RAW264.7 cells after 8 h of LPS exposure. (A) The protein expression of Cox-2, IL-18, NF-κB, and NLRP3. (B) Statistical analysis of protein expression levels. The results were subjected to analysis using one-way analysis of variance followed by Dunnett’s post hoc t-test. # p ≤ 0.05 vs. Ctl, ## p ≤ 0.01 vs. Ctl, * p ≤ 0.05 vs. model, *** p ≤ 0.001 vs. model.

Acknowledgments
This image is the copyrighted work of the attributed author or publisher, and ZFIN has permission only to display this image to its users. Additional permissions should be obtained from the applicable author or publisher of the image. Full text @ Mar. Drugs