
- Title
-
MITF regulates IDH1, NNT, and a transcriptional program protecting melanoma from reactive oxygen species
- Authors
- Roider, E., Lakatos, A.I.T., McConnell, A.M., Wang, P., Mueller, A., Kawakami, A., Tsoi, J., Szabolcs, B.L., Ascsillán, A.A., Suita, Y., Igras, V., Lo, J.A., Hsiao, J.J., Lapides, R., Pál, D.M.P., Lengyel, A.S., Navarini, A., Okazaki, A., Iliopoulos, O., Németh, I., Graeber, T.G., Zon, L., Giese, R.W., Kemeny, L.V., Fisher, D.E.
- Source
- Full text @ Sci. Rep.
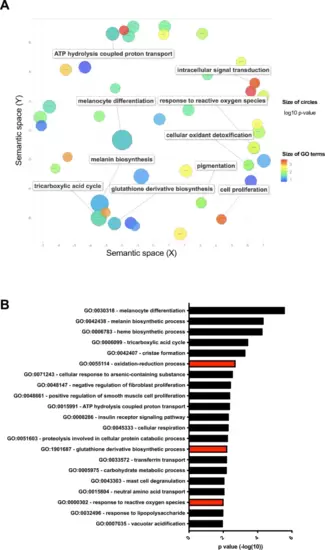
MITF correlates with oxidoreductase activities in multiple datasets. (A) Gene ontology analysis (DAVID followed by REVIGO, for details see Methods) of downregulated genes after MITF knockdown in MALME-3 M cells. (B) Gene functional classification using DAVID revealed that multiple gene sets involved in redox regulation are significantly enriched among genes downregulated after MITF knockdown. Abbreviation: MITF Microphthalmia-associated transcription factor. |
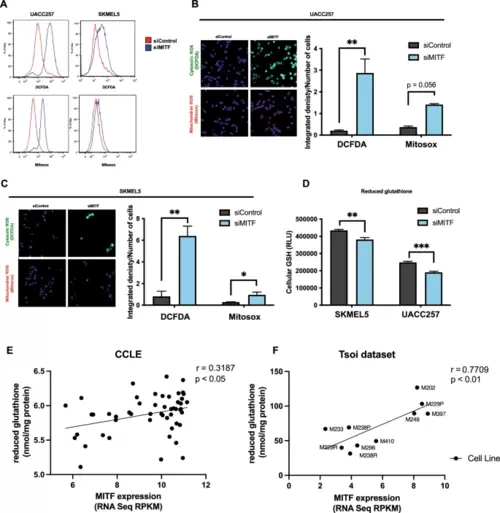
MITF protects melanoma cells from oxidative stress in vitro. (A) Representative flow plots for cytosolic ROS levels measured by DCFDA fluorescent dye and mitochondrial ROS levels measured by Mitosox fluorescent dye in UACC257 melanoma cells after knockdown of MITF. (B) Confocal images of cytosolic ROS levels measured by DCFDA fluorescent dye and mitochondrial ROS levels measured by Mitosox fluorescent dye in UACC257 melanoma cells after knockdown of MITF. Representative images (left panel) and quantification of three independent experiments (right panel, n.s: p = 0.056) are displayed. (C) Confocal images of cytosolic ROS levels measured by DCFDA fluorescent dye and mitochondrial ROS levels measured by Mitosox fluorescent dye in SKMEL30 melanoma cells after knockdown of MITF. Representative images (left panel) and quantification of three independent experiments (right panel) are displayed. (D) Reduced glutathione (GSH) was measured in UACC257 and SKMEL5 melanoma cells after siRNA silencing of MITF. Reduced glutathione levels significantly correlate with MITF expression in melanoma cell lines in CCLE (n = 51, Pearson’s r = 0.32, p < 0.05) (E) and in patient-derived melanoma cells (n = 10, Pearson ‘s r = 0.77, p < 0.01) (F). (Total available melanoma cell lines for microarray data at the Depmap portal: 61) Non-targeting siRNA (siControl) was used as negative control. Values represent the mean ± SEM. *p < 0.05, **p < 0.01, ***p < 0.01. Abbreviation: MITF microphthalmia-associated transcription factor, ROS reactive oxygen species, DCFDA dichlorodihydrofluorescein diacetate, CCLE cancer cell line encyclopedia. |
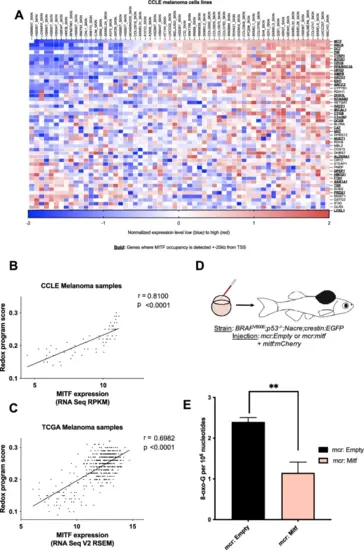
MITF† directly regulates a redox program in melanoma in vivo. (A) Correlation of downregulated genes after MITF knockdown that are annotated with regulation of cellular redox levels across 61 melanoma cell lines in the CCLE microarray dataset. (Total available melanoma cell lines for microarray data at the Depmap portal: 61) MITF occupies promoter or enhancer regions of most of these genes (defined as MITF ChIP peaks within ± 20 kb of a transcription start site (TSS), indicated with bold) based on a publicly available MITF ChIP-sequencing dataset and a ChIP-ChIP dataset. The genes displayed in panel a were used to define an MITF-driven redox program, which was scored using the singscore algorithm in human patient tumor samples from TCGA. Singscore algorithm defined MITF-driven redox program significantly correlates with MITF mRNA levels across melanoma cell lines (CCLE, B, p < 0.001), and 474 human melanoma samples (TCGA, C, p < 0.0001). (D) mitfa:BRAFV600E;p53-/-;mitfa-/-;crestin:EGFP zebrafish were injected at the single cell stage with a MiniCoopR plasmid that rescues melanocytes and expresses human MITF under control of the zebrafish mitfa promoter (mcr:MITF) or with the same plasmid without the human MITF expression cassette (mcr:Empty), along with a plasmid expressing the mCherry marker from the zebrafish mitfa promoter (mitf:mCherry). (E) HPLC-based redox measurements in melanoma tumors from zebrafish re-expressing human MITF (mcr:MITF) or control plasmid (mcr:Empty) at 2 weeks post-fertilization show decreased 8-oxoG levels in MITF overexpressing zebrafish tumors. The mcr_Empty vectors was used as a negative control. Values represent the mean ± SEM. **p < 0.01. Abbreviation: MITF microphthalmia-associated transcription factor, CCLE cancer cell line encyclopedia, TCGA the cancer genome atlas, 8- oxo-G: 8-Dihydro- 8. oxoguanine. |
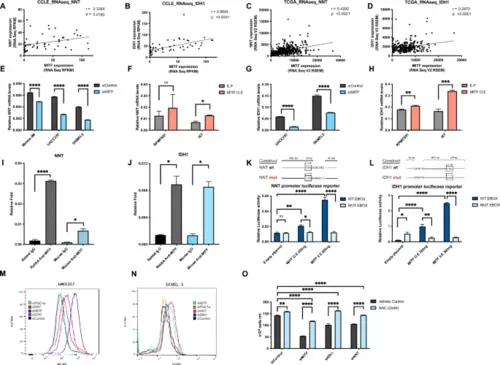
MITF directly targets IDH1 and NNT, and they protect melanoma from oxidative damage. Similar to the microarray dataset, we found significant correlations of MITF with NNT (A) and IDH1 (B) across 54 melanoma cell lines in the CCLE RNA-sequencing datasets and in the (n = 472), (n = 287) (C, D) TCGA RNA-sequencing datasets. (Total available melanoma cell lines for RNA-seq data at the Depmap portal: 54) NNT mRNA levels following knockdown (E) or overexpression (F) of MITF (48 h) in human melanoma cells. IDH1 mRNA levels following knockdown (G) or overexpression (H) of MITF (48 h) in human melanoma cells. ChIP with polyclonal rabbit anti-MITF antibody in UACC257 melanoma cells. Precipitated DNA was amplified using primers surrounding a MITF binding site within the NNT (I) or IDH1 (J) promoter region and compared to rabbit IgG control. Effects of MITF overexpression on luciferase reporter activity driven by the NNT and IDH1 promoter (K, L) with wild type (WT) or impaired (MUT) E-BOX sequences in UACC257 cells. Representative flow plots for cytosolic ROS levels measured by DCFDA fluorescent dye after knockdown of MITF, IDH1, NNT, or PGC1α in UACC257 melanoma cells (M) and in SKMEL30 melanoma cells (N). MITF, IDH1, or NNT silencing induced ROS-dependent melanoma death that is rescuable by 2 mM NAC (N-Acetyl-L-Cystein) in UACC257 melanoma cells (O). Values represent the SD of three independent experiments performed. P values in m and n indicate significance compared to siControl. Non-targeting siRNA (siControl) was used as negative control. All mRNA levels were normalized to RPL11. All luciferase activity were normalized to Renilla. Values represent the mean ± SEM. *p < 0.05 **p < 0.01, ***p < 0.001, ****p < 0.0001. Abbreviations: MITF: Microphthalmia-associated transcription factor, NNT: Nicotinamide nucleotide transhydrogenase, IDH1: Isocitrate dehydrogenase 1, CCLE cancer cell line encyclopedia, TCGA The Cancer Genome Atlas, TYR tyrosinase, ACTB Actin-beta, PGC1a peroxisome proliferator- activated receptor gamma coactivator-1 alpha, NAC N-acetyl-L-cystein. |