
- Title
-
Functional Insights in PLS3-Mediated Osteogenic Regulation
- Authors
- Zhong, W., Neugebauer, J., Pathak, J.L., Li, X., Pals, G., Zillikens, M.C., Eekhoff, E.M.W., Bravenboer, N., Zhang, Q., Hammerschmidt, M., Wirth, B., Micha, D.
- Source
- Full text @ Cells
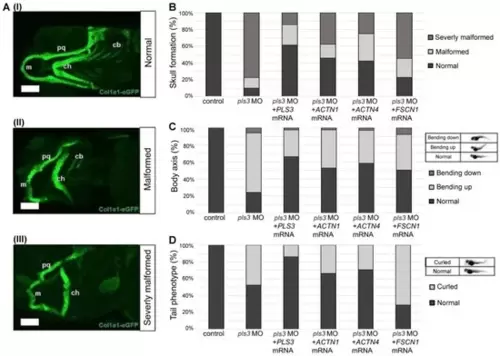
Actinin-1 and Actinin-4 rescue malformation of craniofacial bone structure, body axis, and tail in 5-day-old col1a1:eGFP zebrafish with pls3 morpholino (pls3 MO). (A) Overview of different observed phenotypes of developing skeletal elements in col1α1:eGFP fish (cartilage green) with and without pls3 MO knockdown. Phenotype is subdivided into three different types of severity: (I) normal: all structures are present and developed normally; (II) malformed: m, ch, and pq are shorter and partially malformed; (III) severely malformed: m, ch, and pq are shorter and partially malformed, some cb are absent. (m: Meckel’s cartilage; ch: ceratohyal; pq: palatoquadrate; cb: ceratobranchial). (B) Statistical analysis of phenotypes of control fish compared to knockdown and rescue fish. Control fish show 100% normal skull development, which is significantly reduced to 10.11% in 0.8 mM pls3 MO-treated fish (p < 0.0001). This effect is rescued by co-injection of 300 pg human PLS3, ACTN1, and ACTN4 mRNA (61.43%, 45.90%, and 42.30% normal skull, respectively, compared to pls3 MO: p < 0.0001). Co-injection of FSCN1 mRNA showed 22.72% normal skull development compared to pls3 MO: p = 0.1105. (C) Analysis of body axis form with exemplary pictures for categorization. Control fish show 98.44% normal body axis, which is significantly reduced to 24.32% in 8 mM pls3 MO-treated fish (p < 0.0001). This effect is rescued by co-injection of 300 pg human PLS3, ACTN1, ACTN4, and FSCN1 mRNA (66.28%, 52.87%, 58.47%, and 50.55% normal body axis, respectively, compared to pls3 MO: p < 0.0001). (D) Analysis of tail form with exemplary pictures for categorization. Control fish show 100% normal tail, which is significantly reduced to 52.43% in 0.8 mM pls3 MO-treated fish (p < 0.0001). This effect is rescued by co-injection of 300 pg human PLS3, ACTN1, and ACTN4 mRNA (86.05%, 65.52%, and 72.68% normal tail, respectively, compared to pls3 MO: p < 0.0001, p < 0.05, p < 0.001, and p < 0.001). Co-injection of FSCN1 mRNA only showed 31.87% normal tail compared to pls3 MO: p < 0.001 (for every experimental set-up, n > 50; scale bar = 100 μm). |
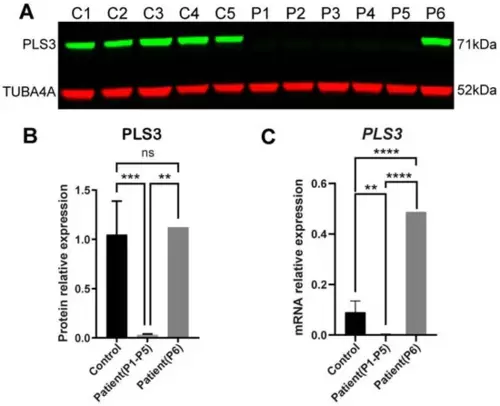
PLS3 expression in fibroblasts from healthy donors and PLS3 patients. (A) PLS3 is undetectable in fibroblast lysates of patients 1(P1), P2, P3, and P4 with the c.235del p.(Tyr79fs) frameshift mutation and P5 with the c.748+1G→A mutation. PLS3 expression of P6 with c.759_760insAAT insertion is stable. (B) Quantified Western blot results. (C) Relative gene expression of PLS3 was measured by qPCR; GAPDH was used to normalize gene expression (error bars indicate standard deviation, ** p < 0.01, *** p < 0.001, **** p < 0.0001). |
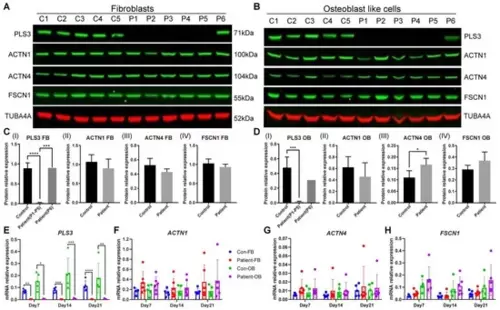
Actin-bundling protein expression in fibroblasts and osteoblast-like cells. The expression of PLS3, ACTN1, ACTN4, and FSCN1 was measured in cell lines from 5 healthy donors and 6 PLS3-variant patients on day 21. Protein expression was detected in whole-cell lysates of (A) primary fibroblasts (FB) and (B) osteoblast-like cells (OB) by Western blotting. (C,D) Quantification of Western blot results; the PLS3 expression of P6 is indicated separately. (E–H) Relative gene expression was measured by qPCR and results were normalized based on the expression of GAPDH (error bars indicate standard deviation per group, * p < 0.05, ** p < 0.01, *** p < 0.001, **** p < 0.0001). |
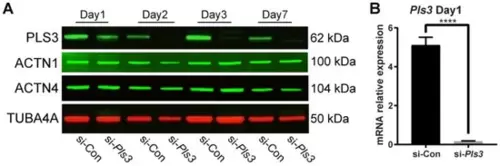
PLS3 knockdown in MLO-Y4 cells. (A) PLS3, ACTN1, and ACTN4 expression determined by Western blotting analysis from day 1 to 7 after the transfection. TUBA4A was used as a loading control. (B) Pls3 mRNA expression after 24 h of transfection. Tbp was used to normalize gene expression. si-Pls3: small interfering Pls3. (Error bars indicate standard deviation, **** p < 0.0001). |

Differential gene expression in MLO-Y4 cells following Pls3 knockdown. (A) Expression of Pls3 analyzed by RNA sequencing. Significant effect of the treatment: ** p < 0.01. (B) The expression of actin-binding proteins was analyzed by RNA sequencing. (C) Heat map shows the expression pattern of mRNAs between the si-Con and si-Pls3 groups: differentially upregulated mRNAs (total 259), and differentially downregulated mRNAs (total 368). (D) KEGG pathway enrichment analysis based on mRNA expression differences between the si-Con and si-Pls3 groups. |
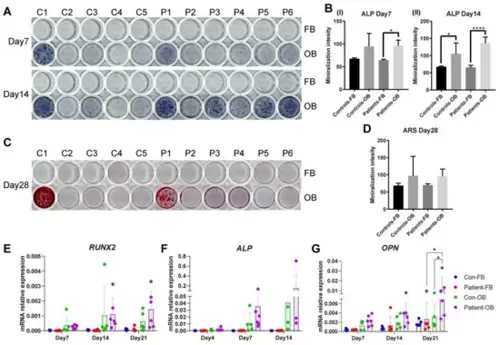
Osteogenic transdifferentiation potential of PLS3 patient-variant fibroblasts. Primary fibroblasts from healthy donors and PLS3-variant patients were subjected to osteogenic transdifferentiation (OB); undifferentiated fibroblasts (FB) were grown in fibroblast medium. (A) Photos show representative results for stainings performed in 11 primary fibroblast cell lines and their transdifferentiated counterparts (C1–C5, P1–P6). Positive ALP staining (purple) on day 14 indicates ALP activity. (B) Quantification of the intensity of ALP staining. Bars indicate the mean of the staining and error bars the standard deviation. (C) ARS staining (red) on day 28 indicates calcium phosphate deposits. (D) Quantification of the intensity of ARS staining. (E–G) Relative gene expression was measured by qPCR for (E) RUNX2, (F) ALP, and (G) OPN. GAPDH was used to normalize gene expression (* p < 0.05, **** p < 0.0001 as measured by ANOVA). |
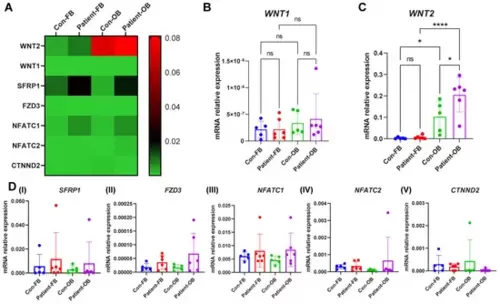
Relative gene expression of WNT pathway components in fibroblasts and osteoblast-like cells of PLS3-variant patients. Fibroblasts and osteoblast-like cells from six PLS3-variant patients and five controls. (A) The heat map shows the relative gene expression measured by qPCR. GAPDH was used to normalize gene expression. Relative gene expression of (B) WNT1, (C) WNT2, and (D) SFRP1, FZD3, NFATC1, NFATC2, and CTNND2 (* p < 0.05, **** p < 0.0001). |