
- Title
-
Structural analysis, anti-inflammatory activity of the main water-soluble acidic polysaccharides (AGBP-A3) from Panax quinquefolius L berry
- Authors
- Zhang, Z., Yan, H., Hussain, H., Chen, X., Park, J.H., Kwon, S.W., Xie, L., Zheng, B., Xu, X., Wang, D., Duan, J.
- Source
- Full text @ J Ginseng Res
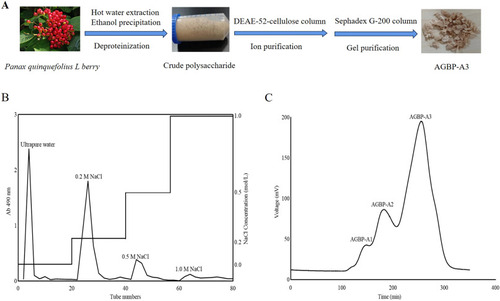
Extraction, isolation and purification of AGBP-A3. (A) whole process (extraction, separation, purification); (B) Elution curve of AGBP-A3 on DEAE-Sepharose Fast Flow column; (C) Elution curve of AGBP-A3 on Sephadex G-200 column. |

Structure analysis of AGBP-A3. (A) HPGPC elution curve of AGBP-A; (B) Monosaccharide composition analysis of AGBP-A3; (C) FT-TR spectrum of AGBP-A3. |
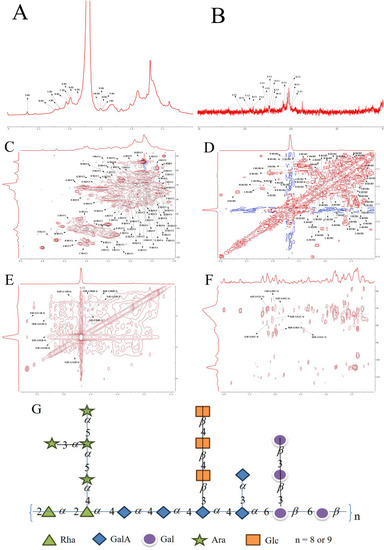
NMR spectra of AGBP-A3. (A)1H spectrum; (B) 13C spectrum; (C) HSQC; (D) 1H–1H COSY; (E) NOESY; (F) HMBC; (G) Putative structure of AGBP-A3. |
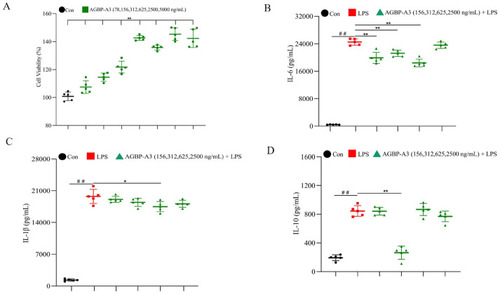
The effect of AGBP-A3 on the secretion of IL-6, IL-1β, IL-10. (A) cells viability; (B) IL-6; (C) IL-1β; (D) IL-10. Data were presented as mean ± standard deviation (n = 5). LPS model group vs con (untreated group), ##P < 0.01. Data vs LPS model group, *P < 0.05, **P < 0.01. |

The effect of AGBP-A3 on CuSO4-induced zebrafish inflammation model. (A) The observation of neutrophil migration; (B)The quantitative results of neutrophil migration. Data were presented as mean ± standard deviation (n = 10). CuSO4 model group vs Con (untreated group), ##P < 0.01. Data vs CuSO4 model group, *P < 0.05, **P < 0.01. |

Ligand interaction of AGBP-A3 with 1CX2. |