
Image
|
Figure Caption
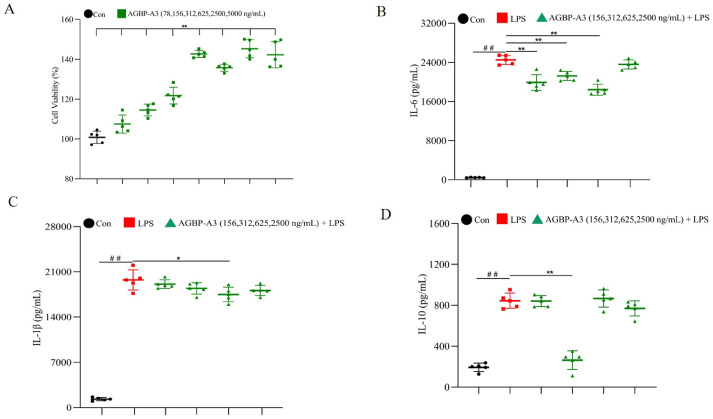
Fig. 4 The effect of AGBP-A3 on the secretion of IL-6, IL-1β, IL-10. (A) cells viability; (B) IL-6; (C) IL-1β; (D) IL-10. Data were presented as mean ± standard deviation (n = 5). LPS model group vs con (untreated group), ##P < 0.01. Data vs LPS model group, *P < 0.05, **P < 0.01.
Acknowledgments
This image is the copyrighted work of the attributed author or publisher, and
ZFIN has permission only to display this image to its users.
Additional permissions should be obtained from the applicable author or publisher of the image.
Full text @ J Ginseng Res