
- Title
-
Instantaneous visual genotyping and facile site-specific transgenesis via CRISPR-Cas9 and phiC31 integrase
- Authors
- Ma, J., Zhang, W., Rahimialiabadi, S., Ganesh, N.U., Sun, Z., Parvez, S., Peterson, R.T., Yeh, J.J.
- Source
- Full text @ Biol. Open

An overview of the TICIT technology for visual genotyping, promoter-tagging, and single-copy, site-specific transgenesis. CRISPR-Cas9 from S. pyogenes (SpCas9) is employed together with a single-stranded oligodeoxynucleotide (ssODN) containing the phiC31 landing site to create attP knock-in fish lines. Next, single-copy site-specific transgene integration is achieved by co-delivering the phiC31 mRNA with any plasmids containing the phiC31 attachment sequence attB. For visual genotyping, two plasmids carrying fluorescent markers driven by a promoter of user's choice (shown as unshaded boxes) are used. This enables Cas9-mediated gene mutations to be identified by fluorescence even before mutant phenotypes manifest. In a heterozygous intercross, wild-type offspring are unmarked, heterozygous offspring are either green or red, and homozygous offspring are both green and red (shown as yellow). For promoter-tagging, a plasmid carrying a promoter-less fluorescent marker adjacent to the attB sequence is used. After phiC31-mediated integration, the promoter activity of the target gene can be tracked by the expression of the fluorescent marker. Further, fish lines carrying attP knock-in at pre-defined loci may enable facile transgenesis devoid of positional and copy number artifacts. |

Generation of the attP knock-in fish lines. (A) Schematic of the SpCas9 target locus for tyr_1 and its corresponding single-stranded oligonucleotide (ssODN). The tyr_1 site is in the first exon (Ex 1) of the tyrosinase gene. Its target sequence is shown, and the spacer adjacent motif (PAM) is highlighted in gray. The cleavage site of SpCas9 is indicated by a pair of scissors. The ssODN used for attP knock-in harbors attP encompassed by two homology arms. The sequences for the homology arms were complementary to the non-target strand of SpCas9 and were 36 nts long on the PAM-distal side and 91 nts on the PAM-proximal side. Complete sequences of the ssODNs for attP knock-in at both tyr_1 and tyr_2 sites can be found in Table S4. (B) Schematic of the attP knock-in at the tyr_1 locus (designated as the attPtyr_1 allele) and the primers for PCR analysis. The thick black line indicates the overlapping sequence with the ssODN. To detect the attP insertion, nested PCR was performed using tyr-specific F1 and R1 primers, followed by F2 and R2 primers that recognize attP and the tyr gene, respectively. (C) Representative agarose gel analysis of the nested PCR from single embryos microinjected with SpCas9 protein, the tyr_1 gRNA, and the ssODN. The expected product size is 110 bps as indicated by a red arrow. M, size marker; 1-12, injected embryos; C, an uninjected control embryo. (D) Representative agarose gel analysis of the nested PCR from the attPtyr_1 founder screen. Twelve pools of embryos (five embryos per pool) from each potential founder were analyzed. The 110-bp band (red arrow) indicated the presence of the attPtyr_1 allele. The pools containing the attP knock-in alleles are labeled by red numbers on top. (E-H). Sequences of the attP knock-in at the tyr_1 (E), tyr_2 (F), gfap (G), and kcnh6a (H) targeted loci in the F1 fish. Endogenous gene sequences are in black letters. Insertions are in red letters. The attP sequences are in uppercase. For attPtyr_1 and attPtyr_2, in-frame stop codons are underlined. For attPgfap and attPkcnh6a, the lowercase letters are sequences added to keep the insertions in-frame for unperturbed translation of the endogenous proteins. |
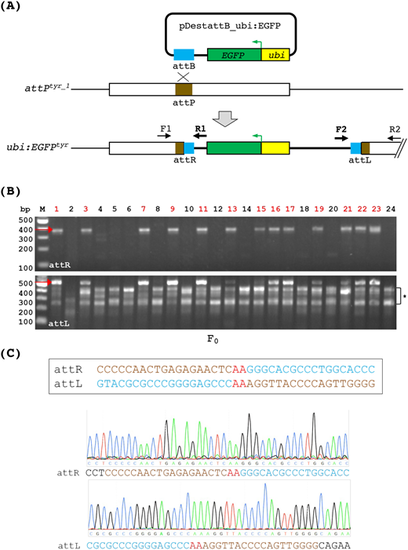
PhiC31 integrase mediates DNA integration via recombination between attB and the genomic attP site. (A) A diagram depicting the integration of ubi:EGFP at the attPtyr_1 locus. PhiC31 integrase mediates recombination between the plasmid DNA containing the attB sequence and the genomic attP site, resulting in single-copy integration of the entire plasmid. The integrated DNA (thick black line) is flanked by two attP/attB composite sequences named attR and attL, which can be detected via PCR using two sets of primers (F1/R1 and F2/R2) as indicated. F1 and R2 are tyr-specific, whereas R1 and F2 are plasmid-specific. (B) PCR analysis of attR and attL in individual embryos microinjected with the phiC31 mRNA and pDestattB_ubi:EGFP. Red arrows indicate the expected product sizes of attR (369 bps, top panel) and attL (534 bps, bottom panel). The bracket with an asterisk on the right side of the bottom gel indicates non-specific amplifications from the F2/R2 primer set. The embryos with the correct size products from both attR and attL PCR are indicated by red numbers on the top. (C) Sanger sequencing of the attR (top chromatogram) and attL (bottom chromatogram) PCR products demonstrates precise DNA integration. Reference sequences for attR and attL are shown in the box above the chromatograms. Sequences originating from attP and attB are indicated in brown and turquoise, respectively. The ‘AA’ crossover site is shown in red. |
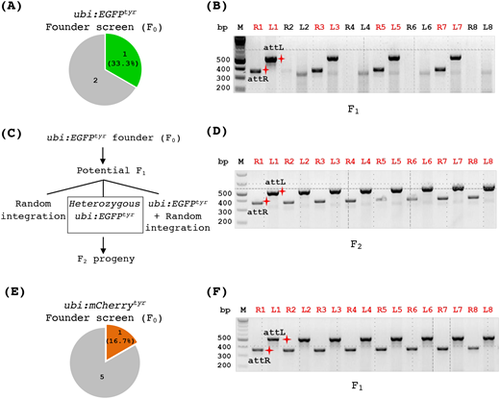
Generation of allele-tracking reporter lines for the tyr mutation. (A,B) Founder screen results of the transgenic ubi:EGFPtyr zebrafish. (A) A pie chart indicating the number of F0 fish screened that produced some fluorescent embryos (the green piece) or all non-fluorescent embryos (the gray piece). (B) PCR analysis of individual fluorescent F1 embryos demonstrating that some of them (labeled by red numbers on top) carried a correct ubi:EGFP integration. ‘R’ and ‘L’ in front of the numbers on top indicate attR and attL PCR, respectively. The red shining star symbols mark the correct size products of attR (369 bps) and attL (534 bps). (C) Schematic depicting potential genotypes of the descendants from an ubi:EGFPtyr founder fish. (D) PCR analysis of individual fluorescent embryos (F2) from a heterozygous ubi:EGFPtyr fish (F1) indicating that all of them carried the correct integration. (E,F) Founder screen results of the transgenic ubi:mCherrytyrzebrafish. (E) A pie chart indicating the number of F0 fish screened that produced some fluorescent embryos (the red piece) or all non-fluorescent embryos (the gray piece). (F) PCR analysis of individual fluorescent F1 embryos showing that all of them carried a correct ubi:mCherry integration. |
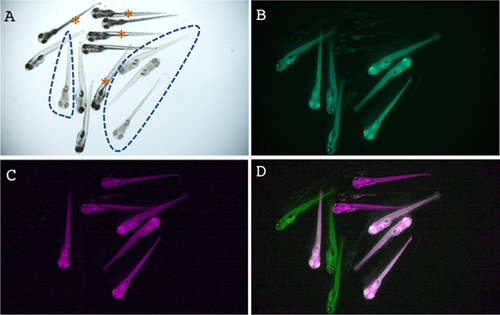
Instantaneous visual genotyping using the tyr allele-tracking reporter lines. (A-D) Visual genotyping results of the tyr mutation using ubi:EGFPtyr and ubi:mCherrytyr, two allele-tracking reporter lines. Heterozygous fish of these two lines were intercrossed, and their offspring were inspected under a fluorescent microscope. The same group of embryos was imaged in the bright field (A), green-fluorescent channel (B, shown in green), and red-fluorescent channel (C, shown in magenta). Images of B and C were merged in D. In panel A, embryos exhibiting the homozygous tyr mutant phenotype, as evidenced by the loss of pigmentation, were encircled by dashed lines. In panel D, embryos that were both green and magenta were white. Embryos that had no fluorescence in B to D were indicated by brown asterisks in A. Hence, the wild-type embryos were unmarked, the heterozygous embryos were either green or magenta, and the homozygous embryos were both green and magenta. |
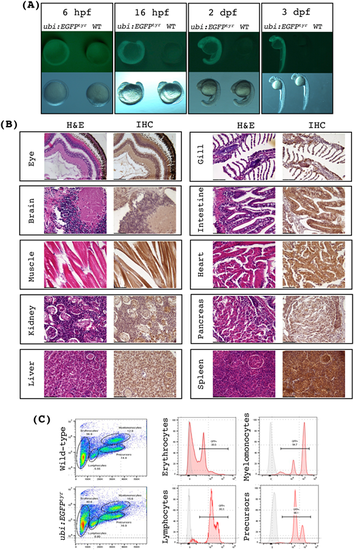
ubi:EGFPtyr transgenic fish exhibit robust and ubiquitous EGFP expression. (A) Bright-field and fluorescence images of ubi:EGFPtyr embryos versus wide-type (WT) at various developmental stages as indicated. Each panel contains an ubi:EGFPtyr embryo on the left and a WT embryo on the right. hpf, hours post fertilization; dpf, days post fertilization. (B) Histology sections of ubi:EGFPtyr adult fish stained with H&E or anti-EGFP antibody (IHC) demonstrating widespread but varying levels of EGFP expression among different tissue and cell types. All images were acquired under 400X magnification. (C) Representative flow cytometry analysis of the wild-type and ubi:EGFPtyr adult whole kidney marrow (WKM). Major blood lineages in WKM were resolved and identified as previously shown (left panels).36 EGFP expression was analyzed in each blood cell gate (middle and right panels). Gray, wild-type; pink, ubi:EGFPtyr. |
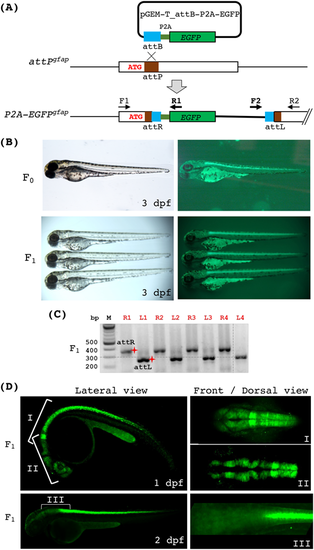
Generation of the endogenous gfap reporter line via phiC31 integrase. (A) A diagram depicting the integration of a promoter-less EGFP reporter at the attPgfap locus via phiC31-mediated recombination. Correct integration of pGEM-T_attB-P2A-EGFP will result in fusion and co-translation of the N-terminus of gfap and P2A-EGFP. We named this allele P2A-EGFPgfap. Two sets of PCR primers (F1/R1 and F2/R2 as indicated) were used to detect the integration. F1 and R2 are gfap-specific, whereas R1 and F2 are plasmid-specific. (B) Bright-field and fluorescence images of endogenous gfap reporter fish embryos at 3 dpf. The top panels show an attPgfap embryo after microinjection with the phiC31 mRNA and pGEM-T_attB-P2A-EGFP. The bottom panels show three heterozygous P2A-EGFPgfap embryos. (C) PCR analysis of individual fluorescent embryos from a founder fish indicating that all of them harbored the correct integration. ‘R’ and ‘L’ in front of the numbers on top indicate attR and attLPCR, respectively. The red shining star symbols mark the correct size products of attR (332 bps) and attL (282 bps). (D) Stacked confocal images of the P2A-EGFPgfap embryos showing various regions and angles of view at 1 and 2 dpf. |