
- Title
-
A deleterious variant of INTS1 leads to disrupted sleep-wake cycles
- Authors
- Confino, S., Wexler, Y., Medvetzky, A., Elazary, Y., Ben-Moshe, Z., Reiter, J., Dor, T., Edvardson, S., Prag, G., Harel, T., Gothilf, Y.
- Source
- Full text @ Dis. Model. Mech.
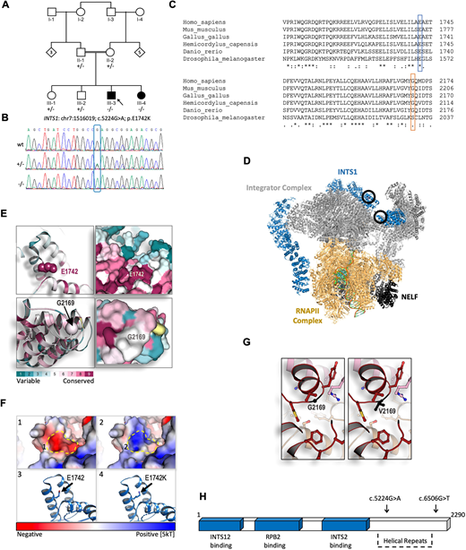
Exome sequencing and structural modelling of INTS1. (A) Pedigree of the family carrying the identified variant. Notice the parental consanguinity. (B) Sanger sequencing confirming the single nucleotide variant c.5224G>A (Gly→Ala) of INTS1 in this family. (C) Predicted amino acid sequences surrounding the altered amino acid residues in the indicated species, demonstrating high evolutionary conservation of human Glu1742 (E1742) and less evolutionary conservation of human Gly2169 (G2169) when compared with the species indicated. (D) Protein structure of the Integrator complex during transcriptional regulation based on Fianu et al. (2021); Protein Data Bank accession code 7PKS (https://www.rcsb.org/structure/7PKS). Main complexes shown are the integrator complex subunit 1 (INTS1, blue); the Integrator subunits 2, 4-9 and 11 (Integrator complex, gray); DNA-directed RNA polymerase subunits β, E, F, RPB3, RPB7, RPB9, POLR2H, RPB10, RNAPII subunits D and K, RNAPII L2 domain-containing protein, and RPBI C-terminal domain peptide (RNAPII complex, gold); negative elongation factors A, B, C/D and E (NELF, black). Black circles indicate the position of the E1742K mutation (top circle) and the G2169V mutation (bottom circle). (E) Evolutionary structural conservation of human INTS1 variants, modelled using the Consurf algorithm (Ashkenazy et al., 2016). Regions surrounding E1742 and G2169 are shown as ribbon (left) and surface views (right). (F) Structural modelling of the E1742K substitution within the C-terminal region of INTS1. (1) Surface view of the conserved glutamic acid introduces a strong negatively charged pocket, indicated by the dashed line (in panels 1 and 2). (2) Surface view of the E1742K substitution. Exchanging the negatively charged E1742 to a positively charged K (Lys) alters the electrostatic dynamics from a strong negative to a strong positive one, predicting interference of surrounding structures. (3) Ribbon view showing the conserved glutamic acid residue. (4) Ribbon view showing the E1742K substitution within the most conceivable rotational isomer, i.e. rotamer, for K in this context. The electrostatic potential is represented by red-to-blue color spectrum, with potential values below −5 kT/e shown in red and values above +5 kT/e in blue; (potential was calculated by solving the Poisson-Boltzmann equation at 310K). (G) Structural modelling of the G2169V substitution. This mutation was modelled in silico using Coot and REFMAC5 (see Material and Methods ‘In silico analysis’). Ball and sticks structures of the WT (left) and mutated protein (right) are shown. (H) Schematic representation of INTS1 protein-interacting regions together with its C-terminal helical repeats tail. Sites of mutated amino acids are indicated by arrows above. |
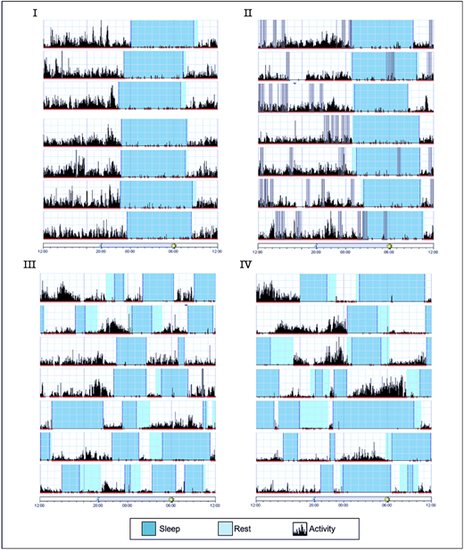
Actigraphy of affected and healthy siblings demonstrating daily sleep arrhythmicity in individuals homozygous for the INTS1 mutated allele. Each horizontal segment of the actigraph depicts a full 24-h cycle from noon to the following noon. The height of the black lines on the chart reflects the extent and frequency of physical activity; blue and cyan depict sleep and rest time, respectively. Gray bars indicate invalid data. Actigraphs I and II of the healthy siblings (aged 10 and 8 years, respectively) show regular sleep patterns with a consistent sleep time and minor variations in waking time, while actigraphs III and IV of the affected children (aged 6 and 5 years, respectively) display several irregular sleep episodes and a substantial lack of daily rhythmicity. |
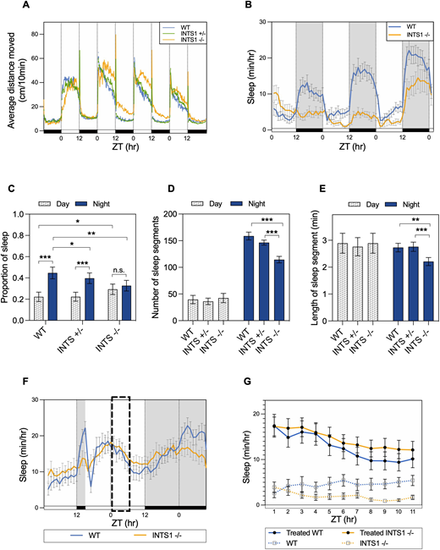
Ints1 function is essential for maintaining locomotor activity and sleep–wake cycles in zebrafish. (A) Locomotor activity analysis of ints1 mutant larvae and their siblings under light/dark (LD) cycles. The average distance moved (cm/10 min) is plotted on the y-axis; the zeitgeber time (ZT, in hours; 0=lights on; 12=lights off) is plotted on the x-axis. White and black horizontal bars indicate light and dark conditions, respectively. n=83 homozygotes (INTS1 −/−); 169 heterozygotes (INTS1 +/−); 72 WT siblings. Progenies of heterozygous intercrosses were exposed to LD cycles and their locomotor activity was measured at 5–8 dpf. (B) Average sleep time of Ints1-deficient (INTS1 −/−) larvae and their WT siblings at 6–8 dpf under LD cycles. The average sleep time [min/h] is plotted on the y-axis; ZT (h) is plotted on the x-axis. White and black horizontal bars indicate light and dark conditions, respectively. Error bars represent ±s.e. (n=24 homozygotes; 24 WT siblings). (C) Sleep proportion separately computed under light and dark conditions using data from 6–8 dpf larvae. Both WT (n=72) and heterozygous (n=169) larvae exhibited a substantial difference in sleep proportion between day and night (***P<0.001, mixed model ANOVA using Type II Wald Chi-squared tests), while no significant difference was observed between day and night for homozygotes (n=83; error bars represent ±s.e.). Homozygous mutants exhibited significantly reduced nighttime sleep compared with WT and heterozygotes (**P<0.01 and *P<0.05, respectively, mixed model ANOVA using Type II Wald Chi-squared tests), and increased daytime sleep compared with WT (*P<0.05, mixed model ANOVA using Type II Wald Chi-squared tests). n.s., non-significant. (D) Number of sleep segments per night is reduced in Ints1-deficient larvae (n=83; ***P<0.001, mixed model ANOVA followed by post-hoc analysis) compared with WT (n=72) and heterozygous (n=169) larvae. Error bars represent ±s.e. (E) Reduced length of sleep segment during the night was observed for ints1-deficient larvae (n=83) compared with WT (n=72) and heterozygous (n=169) larvae (**P<0.01 and ***P<0.001, mixed model ANOVA followed by post-hoc analysis). Error bars represent ±s.e. (F) LD-trained larvae were exposed to 9 h of sleep deprivation, starting from 3 h after lights out. The average sleep time (min/h) is plotted on the y-axis; ZT (h) is plotted on the x-axis. White and black horizontal bars indicate light and dark conditions, respectively. Error bars represent ±s.e. (n=33 homozygotes; 38 WT siblings). Normal sleep rebound (indicated by dashed box) was measured in homozygotes with respect to their WT siblings. (G) Sleep rebound was measured in sleep-deprived WT and Ints1-deficient larvae compared with non-deprived larvae during the day after sleep-deprivation treatment. The average sleep time (min/h) is plotted on the y-axis; ZT (h) is plotted on the x-axis. Error bars represent ±s.e. (n=34 homozygotes; 32 WT siblings). Both genotypes exhibited a typical consolidated sleep pattern after the sleep-deprivation treatment. |
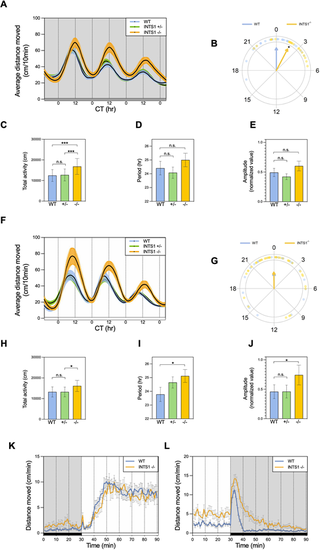
Abnormal circadian rhythms of locomotor activity and dark-response in Ints1-deficient zebrafish larvae. (A) Circadian locomotor activity of 6–8 dpf ints1 homozygous (−/−) mutant larvae, and their heterozygous (−/+) and wild-type (+/+) siblings under constant dim light (DimDim, 7.5 lux). Progenies of heterozygous intercrosses were entrained under light/dark (LD) cycles for 3 days, followed by 2 days of light/dim light (LDim) cycles, and then exposed to DimDim for an additional 3 days, during which their activity was monitored. The x-axis represents the circadian time (CT, in hours); the y-axis represents the average distance travelled (cm/10 min). Colored areas represent the ±s.e. (n=31 homozygotes; 63 heterozygotes; 33 WT siblings). The gray horizontal bar at the bottom represents the illumination during monitoring, DimDim. (B) Circular plot depicting the phase of circadian locomotor activity rhythm of ints1-deficient (INTS1−/−) mutants (yellow) with respect to that of WT siblings (blue) under DimDim; each dot represents the value for one individual larvae. Arrow direction indicates the mean phase of each genotype, arrow length is inversely related to variation within the group. A 2-h phase-delay was observed for ints1 mutants (*P<0.05, Watson-Williams test). (C–E) Under DimDim, Ints1-deficient larvae exhibit higher total locomotor activity (measured as distance moved in cm; ***P<0.001, mixed model ANOVA using Type II Wald Chi-squared tests) (C) with minor and insignificant variations in duration period (in hours) and amplitude (D and E, respectively) compared with WT larvae. n.s., non-significant; error bars represent ±s.e. (F) Circadian locomotor activity of 6–8 dpf ints1 mutant larvae and their siblings under constant light (LL, 980 lux). Progenies of heterozygous intercrosses were entrained under LD cycles for 3 days, followed by 2 days of LDim cycles, and then exposed to LL for an additional 3 days, during which their activity was monitored. The x-axis represents the circadian time (CT, hours); the y-axis represents the average distance travelled (cm/10 min). Colored areas represent the ±s.e. (n=37 homozygotes; 67 heterozygotes; 35 WT siblings). The white horizontal bar at the bottom represents the illumination during monitoring, LL. (G–J) Under LL, Ints1-deficient larvae exhibit no differences in circadian phase compared to their WT siblings (G), but show significantly higher total activity (cm), longer period length (hours), and higher amplitude (*P<0.05 for all effects, mixed model ANOVA using Type II Wald Chi-squared tests). ‘n.s.’ denotes non-significant; error bars in H-J represent ±s.e. (K,L) Motor activity response of ints1-deficient larvae and their WT siblings to photic transitions, i.e. light-to-dark (K) and dark-to-light (L). LD-entrained larvae (5 dpf) were exposed to alternating light–dark conditions, and their activity was measured before and after the photic transition. The x-axis represents the time (min); the y-axis represents the average distance travelled (cm/min). Horizontal white and black bars (bottom) represent illumination during monitoring, i.e. light and dark, respectively. Error bars represent ±s.e. (n=33 homozygotes; 38 WT siblings). While no differences between genotypes were observed in response to the transition from dark to light (K), homozygous mutant larvae exhibited an irregular response to the transition from light to dark compared with their WT siblings, characterized by extended activity in response to darkness (L). |
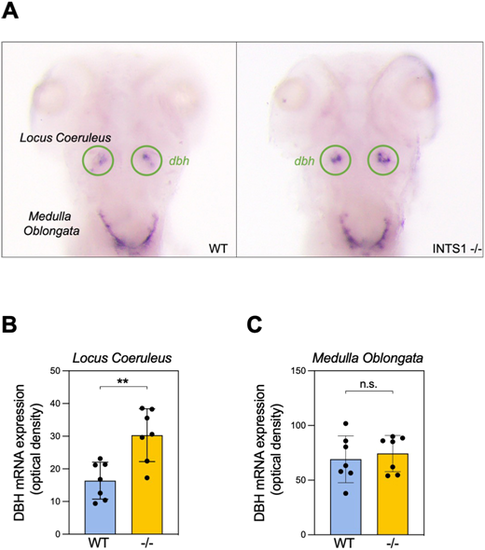
Ints1-deficient zebrafish larvae exhibit increased dbh mRNA expression in the locus coeruleus but not in the medulla oblongata. (A) Representative image, showing of dbh mRNA expression by whole-mount in situ hybridization of 5 dpf Ints1-deficient (right) and WT sibling (left) larvae (dorsal views). The locus coeruleus is encircled (green). (B) Quantification of the dbh mRNA signal in the locus coeruleus reveals significantly elevated expression in Ints1-deficient (−/−) larvae compared with their WT siblings (**P<0.01, two-tailed t-test assuming equal variance; n=7). (C) Quantification of dbh mRNA levels in the medulla oblongata shows no difference between Ints1-deficient larvae and their WT siblings (n=7). Error bars in B and C represent ±s.e. |

ZFIN is incorporating published figure images and captions as part of an ongoing project. Figures from some publications have not yet been curated, or are not available for display because of copyright restrictions. EXPRESSION / LABELING:
PHENOTYPE:
|
|
Unillustrated author statements PHENOTYPE:
|