
- Title
-
Effects of two chd2-knockout strains on the morphology and behavior in zebrafish
- Authors
- Li, T., Li, W., Li, F., Lin, J., Zhang, Y., Zhang, Q., Sun, Y., Chen, X., Zhou, S., Li, Q.
- Source
- Full text @ Dev. Genes Evol.
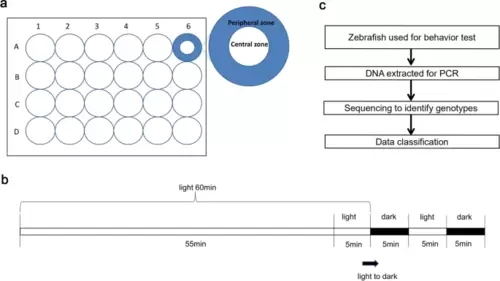
Schematic diagram of the zebrafish larval behavior experiment and experiment time periods. a Schematic diagram of experiments in which zebrafish juveniles swim in 24-well plates. b Zebrafish larval experiment time periods. c Experimental procedure to genotyped mutants |
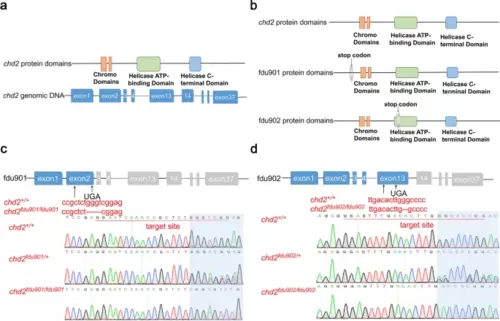
Generation of chd2 mutation in zebrafish by CRISPR/Cas9 gene editing and protein function comparison of two chd2–knockout zebrafish strains. a Structure of zebrafish chd2 gene and protein from https://www.uniprot.org/uniprot/A0A0R4IR86. b The CRISPR/Cas9-induced mutations in chd2 in fdu901 and fdu902 are shown in protein structure. c Exon 2 is the target for CRISPR/Cas9 gene editing in zebrafish chd2 in fdu901. The CRISPR/Cas9-induced mutation (4-base deletion) in chd2 is shown in annotated chd2 mutant sequences. “-” are deleted nucleotides. d Exon13 is the target for CRISPR/Cas9 gene editing in zebrafish chd2 in fdu902. The CRISPR/Cas9-induced mutation (1-base deletion) in chd2 is shown in annotated chd2 mutant sequences. “-” are deleted nucleotide |
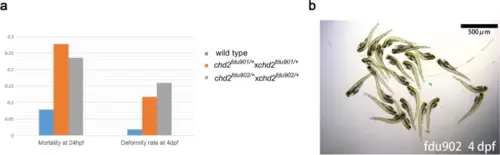
Morphological characteristics and mortality of chd2fdu901/+ x chd2fdu901/+, chd2fdu902/+ x chd2fdu902/+ and chd2+/+ x chd2+/+ zebrafish. a Mortality rate at 24hpf and deformity rate at 4dpf in fdu901, fdu902, and wild-type zebrafish (wild type, N = 599; fdu901, N = 555; fdu902, N = 548). b Bending deformity in fdu902 at 4 dpf, μm: micrometer PHENOTYPE:
|
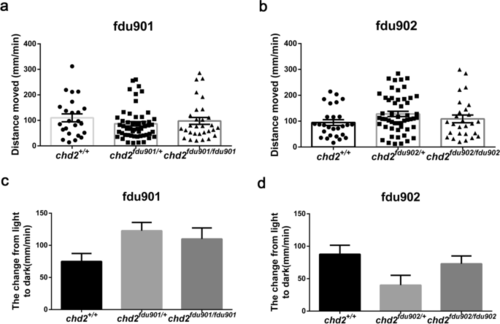
Fdu901 and fdu902 zebrafish larvae displayed locomotor activity. The Y axis shows the normalized distance (millimeters) traveled by larvae in each 1-min bin. a Comparison of locomotor activity in chd2 fdu901; chd2+/+ = 24, chd2fdu901/+ = 54, chd2fdu901/fdu901 = 30. b Comparison of locomotor activity in chd2 fdu902; chd2+/+ = 27, chd2fdu902/+ = 53, chd2fdu902/fdu902 = 27. c Light/dark test of fdu901 zebrafish larvae. d Light/dark test of fdu902 zebrafish larvae. * p < 0.05 PHENOTYPE:
|
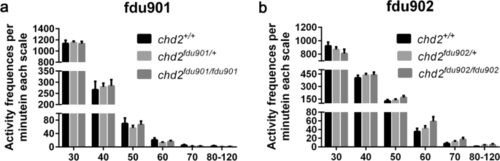
Fdu901 and fdu902 zebrafish larvae displayed intensity activity in the first 25 min. a The frequency of activity in fdu901 zebrafish was measured at six activity intensities (30, 40, 50, 60, 70 and 80–120) in the first 25 min; chd2+/+ = 24, chd2fdu901/+ = 54, chd2fdu901/fdu901 = 30. b The frequency of activity in fdu902 zebrafish was measured at six activity intensities (30, 40, 50, 60, 70 and 80–120) in the first 25 min; chd2+/+ = 27, chd2fdu902/+ = 53, chd2fdu902/fdu902 = 27. * p < 0.05 PHENOTYPE:
|
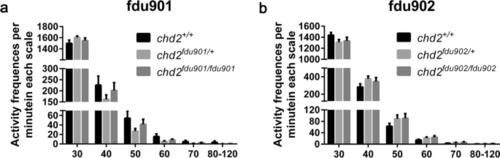
Fdu901 and fdu902 zebrafish larvae displayed activity intensity from 30 to 60 min. a The activity frequency of fdu901 zebrafish was measured at six activity intensities (30, 40, 50, 60, 70 and 80–120) from 30 to 60 min; chd2+/+ = 24, chd2fdu901/+ = 54, chd2fdu901/fdu901 = 30. b The activity frequency of fdu902 zebrafish was measured at six activity intensities (30, 40, 50, 60, 70 and 80–120) from 30 to 60 min; chd2+/+ = 27, chd2fdu902/+ = 53, chd2fdu902/fdu902 = 27. * p < 0.05 PHENOTYPE:
|
Fdu901 and fdu902 zebrafish showed no significant variations in center/periphery location. a Center/periphery location in fdu901 zebrafish was measured from 30 to 60 min; chd2+/+ = 24, chd2fdu901/+ = 54, chd2fdu901/fdu901 = 30. b Center/periphery location in fdu902 zebrafish was measured from 30 to 60 min; chd2+/+ = 27, chd2fdu902/+ = 53, chd2fdu902/fdu902 = 27. * p < 0.05 PHENOTYPE:
|