
IMAGE
Fig. 4
- ID
- ZDB-IMAGE-250103-39
- Publication
- Li et al., 2024 - Effects of two chd2-knockout strains on the morphology and behavior in zebrafish
- All Figures
- Figures for Li et al., 2024
Image
|
Figure Caption
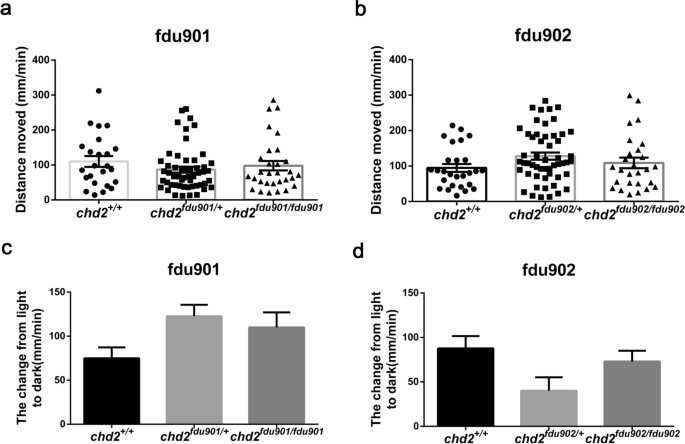
Fig. 4 Fdu901 and fdu902 zebrafish larvae displayed locomotor activity. The Y axis shows the normalized distance (millimeters) traveled by larvae in each 1-min bin. a Comparison of locomotor activity in chd2 fdu901; chd2+/+ = 24, chd2fdu901/+ = 54, chd2fdu901/fdu901 = 30. b Comparison of locomotor activity in chd2 fdu902; chd2+/+ = 27, chd2fdu902/+ = 53, chd2fdu902/fdu902 = 27. c Light/dark test of fdu901 zebrafish larvae. d Light/dark test of fdu902 zebrafish larvae. * p < 0.05
Figure Data
Acknowledgments
This image is the copyrighted work of the attributed author or publisher, and
ZFIN has permission only to display this image to its users.
Additional permissions should be obtained from the applicable author or publisher of the image.
Full text @ Dev. Genes Evol.