
- Title
-
Plaat1l1 controls feeding induced NAPE biosynthesis and contributes to energy balance regulation in zebrafish
- Authors
- Mashhadi, Z., Yin, L., Dosoky, N.S., Chen, W., Davies, S.S.
- Source
- Full text @ Prostaglandins Other Lipid Mediat.

Tissue levels of N-acyl-phosphatidylethanolamine (NAPE) and N-acyl-ethanolamine (NAE) in zebrafish fasted for 48 h and after 30 min of re-feeding with a standard flake diet. A) Apparent concentrations of individual NAPE species (left panel) and total NAPEs (right panel), measured as GP-NAEs after methylamine hydrolysis, in whole intestines. B) Apparent concentrations of individual NAE species (left panel) and total NAEs (right panel) in the whole intestine. C) Apparent concentrations of individual NAPE species (left panel) and total NAPEs (right panel), measured as GP-NAEs after methylamine hydrolysis, in the whole brain. D) Apparent concentrations of individual NAE species (left panel) and total NAEs (right panel) in the whole brain. All figures are mean ± s.e.m., n=5–7 fish. |

Consumption of a high-fat/high cholesterol diet (HFD) reduces feeding-induced intestinal NAPE biosynthesis. Wild-type fish had their standard flake diet supplemented with (HFD) or without (STD) egg yolk for 5 days. Fish were then fasted for 48 h and one half of each group re-fed standard flake diet for 30 min. Apparent concentrations of individual NAPE species in the intestine were measured as GP-NAEs after methylamine hydrolysis. A. Individual intestinal NAPE profiles of fish fed STD. B. Individual intestinal NAPE profiles of fish fed HFD. C. Total intestinal NAPEs for each diet and condition to show overall NAPE response to feeding. All figures are mean ± s.e.m., n=5–7 fish. |

Multiple-sequence alignment and phylogenic tree of zebrafish Plaat isoforms and their homologs in human and mouse. A) Protein alignment generated by EMBL-LBI, asterisks denote residues identical in all PLAAT homologs, with conserved active site residues highlighted with black. B) Calculated phylogenic tree generated by SHOOT [49] using Plaat1l1 sequence for the search input. |
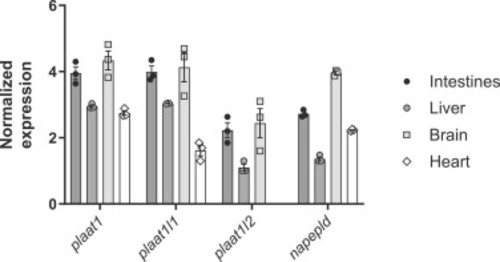
Expression of NAE biosynthetic genes in various zebrafish tissue. qPCR was used to determine the expression of plaat1, plaat1l1, plaat1l2, and napepld relative to reference gene elf1a in wild-type adult zebrafish. N = 3 biological samples, with each biological sample consisting of organs from 3 zebrafish. |

Creation of plaat deletion zebrafish lines. CRISPR/cas9 with appropriate sgRNA were used to generate the plaat1-/-, plaat1l1-/-, and plaat1l2-/- zebrafish lines. For each knock-out line, the nucleotide sequence target by the sgRNA is underlined, and the sequencing results, the base pairs deleted in each knockout line, and the predicted change in amino acid, respectively, are shown. |

Effect of plaat gene deletion on whole body NAPEs. The apparent whole-body concentrations of total NAPEs (A) and individual NAPE species (B), measured as GP-NAEs after methylamine hydrolysis, in 2-month-old wild type, plaat1-/-, plaat1l1-/-, and plaat1l2-/- zebrafish. N = 3 fish per group, results are expressed as mean ± s.e.m. |

Plaat1l1-/- fish fail to increase intestinal NAPE levels in response to re-feeding. The apparent concentrations of total NAPE, measured as GP-NAEs after methylamine hydrolysis, in the intestine of wild-type (left panel), plaatl1-/- (middle panel), and plaat1l2-/- (right panel) zebrafish fasted for 48 h and then half of each group being refed standard flake diet for 30 min. The results are expressed as mean ± SEM, n=7, ***p=0.0003 and *p=0.0120, two-tailed unpaired t-test. |
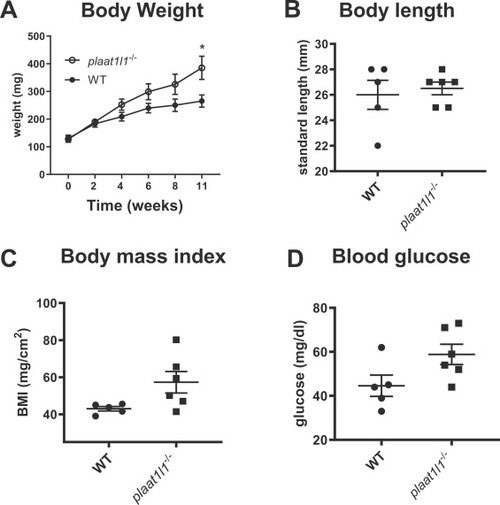
Effects of plaat1l1-/- on weight gain, body mass index, and fasting blood glucose. Wild-type and plaat1l1-/- zebrafish of similar weight at day 0 were fed a standard flake diet for 11 weeks and body weight measured periodically. At the end of the 11-week study, fish were euthanized, and body length and blood glucose subsequently measured. A) Body weight, 2-way ANOVA time p=0.0004, genotype p=0.0061, time x genotype p=0.1001, *p=0.0373 uncorrected Fisher’s LSD wt vs plaat1l1-/- week 11. B) Fish length at week 11, p>0.999, two-tailed unpaired t-test. C) Body mass index (mg/cm2) at week 11, p=0.0519, two-tailed unpaired t-test. D) Blood glucose level at week 11, p=0.0632, two-tailed unpaired t-test. All results are presented as mean ± SEM. |