
Fig. 1
- ID
- ZDB-IMAGE-240913-1
- Publication
- Mashhadi et al., 2024 - Plaat1l1 controls feeding induced NAPE biosynthesis and contributes to energy balance regulation in zebrafish
- All Figures
- Figures for Mashhadi et al., 2024
|
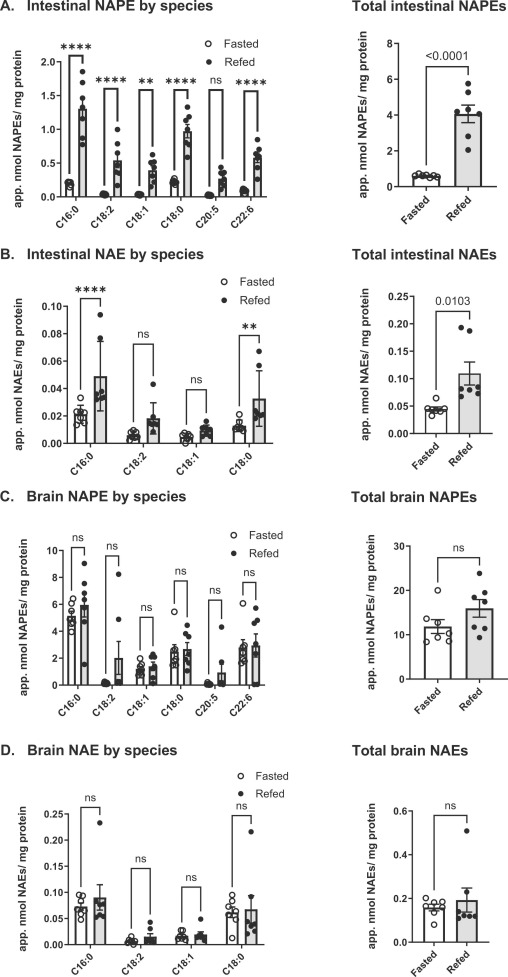
Fig. 1 Tissue levels of N-acyl-phosphatidylethanolamine (NAPE) and N-acyl-ethanolamine (NAE) in zebrafish fasted for 48 h and after 30 min of re-feeding with a standard flake diet. A) Apparent concentrations of individual NAPE species (left panel) and total NAPEs (right panel), measured as GP-NAEs after methylamine hydrolysis, in whole intestines. B) Apparent concentrations of individual NAE species (left panel) and total NAEs (right panel) in the whole intestine. C) Apparent concentrations of individual NAPE species (left panel) and total NAPEs (right panel), measured as GP-NAEs after methylamine hydrolysis, in the whole brain. D) Apparent concentrations of individual NAE species (left panel) and total NAEs (right panel) in the whole brain. All figures are mean ± s.e.m., n=5–7 fish.