
- Title
-
Deficiency in Prader-Willi syndrome gene necdin leads to attenuated cardiac contractility
- Authors
- Dong, Y., Lu, R., Cao, H., Zhang, J., Wu, X., Deng, Y., Li, J.D.
- Source
- Full text @ iScience

Necdin deficiency impaired heart function (A) Representative M-mode images (upper: wild-type mouse; lower: necdin KO mouse). Double-headed arrows mark left ventricle systolic and diastolic internal diameters (LVIDs and LVIDd), respectively. (B–D) Quantification of echocardiograms: ejection fraction (B), fraction shortening (C), and heart rate (D). Data are presented as means ± SEM; WT: n = 14; KO: n = 11; ∗p < 0.05, ∗∗p < 0.01, unpaired t test. (E–H) Echocardiographic image acquisition and speckle-tracking analysis. (E) Representative long-axis B-mode images of left ventricle during diastole and systole period in WT or KO mice. The tracking trace was overlaid on the images showing in the right panels. (F) The global longitudinal strain (GLS) and global longitudinal strain rates (GLSR) in 3 pairs of 4 months male mice. (G) Representative short-axis B-mode images of left ventricle during diastole and systole period in WT or KO mice. The tracking trace was overlaid on the images showing in the right panels. (H) The global circumferential strain (GCS) and GCS rates in 3 pairs of 4 months male mice. Data are presented as means ± SEM; ∗p < 0.05, unpaired t test. (I) Representative contraction of cardiac myocytes from WT and KO mice at 4 months of age. (J–L) Quantification of cardiac myocyte contraction: amplitude of contraction (J), maximal velocity of re-lengthening (K), and maximal velocity of shortening (L). Data are presented as means ± SEM, WT: n = 24; KO: n = 24; ∗p < 0.05, ∗∗p < 0.01 and ∗∗∗p < 0.001, unpaired t test. (M) Representative gross anatomy from a WT and a KO mouse at 4 months of age. Statistical data are shown as means ± SEM, WT: n = 6; KO: n = 6; ns: no significant difference, unpaired t test. (N) Cardiomyocyte cross-sectional area (using wheat-germ-agglutinin staining) from WT and KO mice at 4 months. Statistical data are shown as means ± SEM, WT: n = 6; KO: n = 6; ns: no significant difference, unpaired t test. Scale bars: 50 μm. |

Necdin interacted with MYL12A (A) Interaction of necdin and MYL12A as assessed with a yeast two-hybrid assay. The term pGBKT7-necdin denotes necdin fused to a DNA-binding domain, whereas pGADT7-Myl12a denotes Myl12a fused to an activation domain. Only yeast colonies co-transformed with pGADT7-Myl12a and pGBKT7-necdin could grow and turn blue on an SD/-Leu/-Trp/AbA/X-α-Gal plate. (B) Interaction of necdin and MYL12A as assessed with a co-immunoprecipitation (coIP) assay. H9C2 cells were transfected with the indicated plasmids, and protein lysates were precipitated with antibodies against HA or Flag. Immune complexes were blotted with antibody against HA or Flag, respectively. (C) Necdin interacts with MYL12A endogenously as assayed with a coIP assay in H9C2 cells. Cell lysates were immunoprecipitated with antibodies against necdin, MYL12A, or control IgG, and immune complexes were blotted with antibodies against necdin or MYL12A, respectively. (D) Interaction of MYL12A and full-length or truncated necdin as assayed by a coIP assay. HA-tagged MYL12A and FLAG-tagged necdin fragments were expressed in H9C2 cells; the cell lysate was immunoprecipitated with Flag antibody, and the immune complex was blotted with HA antibody and Flag antibody, respectively. |

Necdin regulated the stabilization of MYL12A (A and B) Expression of MYL12 A/B/MYL9 in hearts from WT and necdin-deficient (KO) mice. Data are presented as means ± SEM, WT: n = 3; KO: n = 3; ∗p < 0.05, ∗∗p < 0.01 and ∗∗∗p < 0.001, unpaired t test. (C and D) Overexpression of necdin increased the MYL12A protein levels in H9C2 cells. Representative immunoblots (C) and quantification of three independent experiments (D) are shown. Data are presented as means ± SEM, n = 3; ∗∗p < 0.01, unpaired t test. (E and F) RNA interference of necdin decreased MYL12A in H9C2 cells. Representative immunoblots (E) and quantification of three independent experiments (F) are shown. Data are presented as means ± SEM, n = 3; ∗∗p < 0.01, unpaired t test. (G and H) RNA interference of necdin accelerates the degradation of MYL12A protein levels in H9C2 cells. Cycloheximide (CHX, 200 μg/mL) was used to inhibit protein synthesis. The representative immunoblots (G) and quantification of three independent experiments (H) are shown. Data are presented as means ± SEM; ∗p < 0.05, ∗∗p < 0.01, ∗∗∗p < 0.005, Bonferroni post hoc analysis, two-way ANOVA; NC, negative control. (I) RNA interference of necdin increases the ubiquitination level of MYL12A. H9C2 cells were transfected with the indicated plasmids or siRNAs. Cell lysates were immunoprecipitated with an antibody against Myc, and ubiquitination was detected with an anti-HA antibody. |

SGT1-HSP90 pathway regulated MYL12A stability (A) Necdin-SGT1-MYL12 A/B/MYL9 formed a complex in H9C2 cells. An anti-SGT1 antibody, anti-necdin antibody, or control IgG was used to immunoprecipitate cell lysate from H9C2 cells; immune-complexes were blotted with the indicated antibodies. (B and C) RNA interference of Sgt1 decreased MYL12A in H9C2 cells. Representative immunoblots (B) and quantification of three independent experiments each group (C) are shown. Data are presented as means ± SEM, n = 3; ∗∗p < 0.01, unpaired t test. (D and E) Overexpression of SGT1 increased the MYL12A protein levels in H9C2 cells. Representative immunoblots (D) and quantification of three independent experiments (E) are shown. Data are presented as means ± SEM, n = 3; ∗∗p < 0.01, unpaired t test. (F) RNA interference of Sgt1 increases the ubiquitination level of MYL12A. H9C2 cells were transfected with the indicated plasmids or siRNAs. Cell lysates were immunoprecipitated with an antibody against Myc, and ubiquitination was detected with an anti-HA antibody. (G-J) Representative immunoblots (upper lane) and statistics data of three independent experiments (lower lane) from H9C2 cells following treatment with different concentrations of HSP90 inhibitors 17-AAG (G and H) or geldanamycin (GA) (I and J). Data are presented as means ± SEM, ∗p < 0.05; ∗∗p < 0.01, post hoc Dunnett’s t test, one-way ANOVA. |
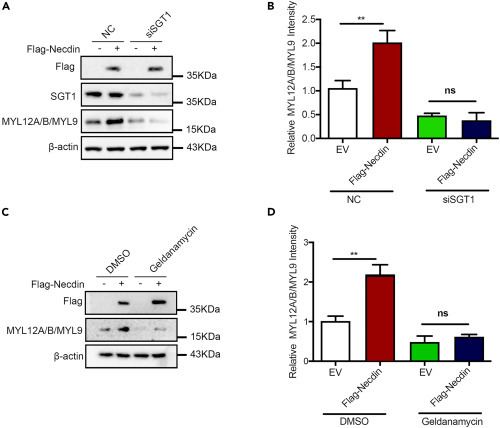
Necdin regulated MYL12A stability in a SGT1- and HSP90-dependent manner (A and B) Necdin failed to increase MYL12A protein levels in Sgt1-depleted (siSgt1) H9C2 cells. Representative immunoblots (A) and statistics data of three independent experiments (B) are shown. Data are presented as means ± SEM, ∗p < 0.05, unpaired t test. (C and D) Necdin failed to increase MYL12A protein levels in H9C2 cells treated with HSP90 inhibitor GA. Representative immunoblots (C) and statistics data of three independent experiments (D) are shown. Data are presented as means ± SEM, ∗p < 0.05, unpaired t test. |
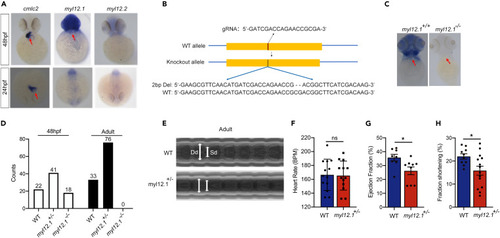
MYL12.1 deficiency in zebrafish led to cardiac dysfunction (A) The expression of MYL12.1 and MYL12.2 genes in zebrafish heart as analyzed by using whole-mount ISH. Red arrowheads indicate the location of the heart. (B) The CRISPR-Cas9 technique was used to generate MYL12.1 allele in zebrafish. A gRNA targeting the exon 2 of MYL12.1 gene was injected with Cas9 protein into zebrafish embryos, resulting in a 2-bp deletion. (C) ISH was employed to validate the knockout of MYL12.1 in zebrafish. (D) The distribution of different genotypes in the zebrafishes harvested at 48 h postfertilization embryos or in adulthood. (E) Representative M-mode images (upper: wild-type zebrafish; lower: myl12.1+/− zebrafish). Double-headed arrows mark ventricle systolic and diastolic internal diameters, respectively. (F–H) The heart rate (F), ejection fraction (G), and fraction shortening (H) of adult WT and MYL12.1+/− zebrafishes as analyzed with echocardiograms. Data are presented as means ± SEM; ∗p < 0.05, unpaired t test. |
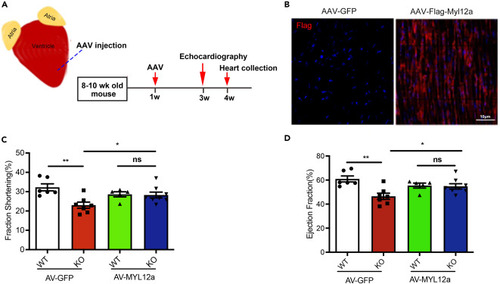
Myocardium delivery of AAV9-Flag-MYL12A in necdin-deficient mice rescued cardiomyopathy symptoms (A) Experimental scheme of virus injection into left ventricle myocardium. (B) Representative picture of Flag-MYL12A expression after virus injection. Immunofluorescence stained by anti-Flag antibody. (C-D) Fraction shortening (C) and Ejection fraction (D) quantification of WT and KO mice with or without overexpression of MYL12A. Data are presented as means ± SEM, ∗p < 0.05; ∗∗p < 0.01 unpaired t test. |