
- Title
-
Amphiphilic hydroxyethyl starch-based nanoparticles carrying linoleic acid modified berberine inhibit the expression of krasv12 oncogene in zebrafish
- Authors
- Yu, X., Zhao, W., Zou, Q., Wang, L.
- Source
- Full text @ Biomed. Pharmacother.
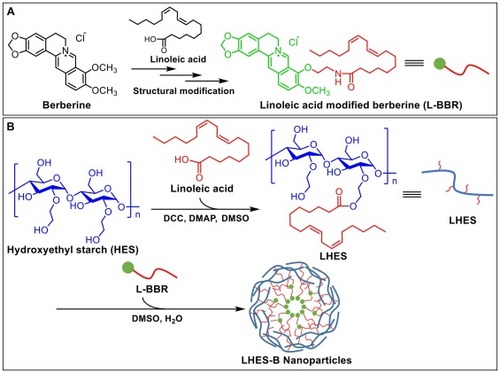
(A) Structural modification of berberine affords L-BBR; (B) Preparation of LHES-B nanoparticles. |

The FTIR spectra of HES and LHES carriers (linoleic acid/HES, 0.45/1). |
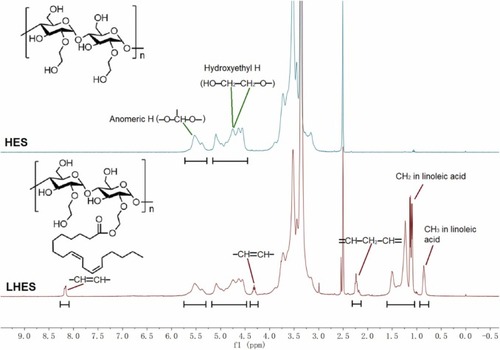
The 1H NMR spectra of HES and LHES carriers (linoleic acid/HES, 0.45/1). |
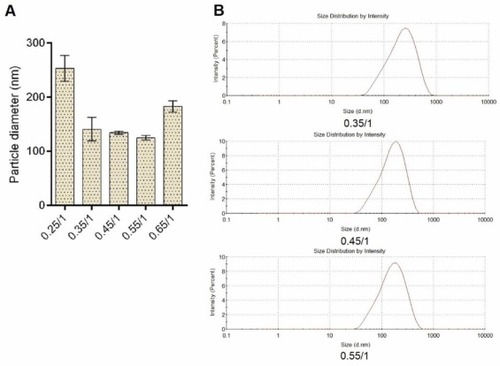
(A) Hydrodynamic particle diameters of LHES-B nanoparticles obtained from different mass ratios of linoleic acid/HES (0.25/1, 0.35/1, 0.45/1, 0.55/1, and 0.65/1). (B) Particle size distribution curves of LHES-B nanoparticles obtained from different mass ratios of linoleic acid/HES (0.35/1, 0.45/1, and 0.55/1). |
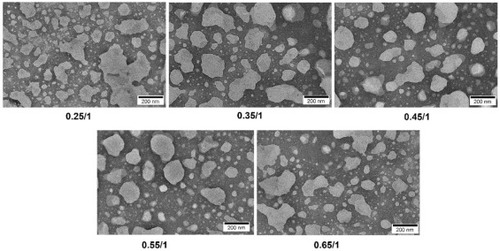
TEM images of LHES-B nanoparticles obtained from different mass ratios of linoleic acid/HES (0.25/1, 0.35/1, 0.45/1, 0.55/1, and 0.65/1). Scale bar is 200 nm. |
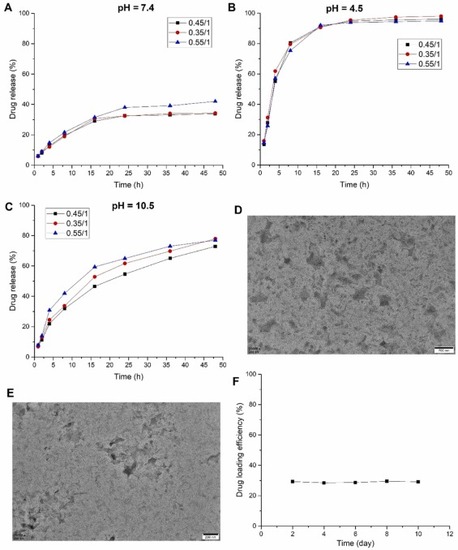
Drug release behavior of LHES-B nanoparticles under different pH conditions, (A) pH = 7.4, (B) pH = 4.5, (C) pH = 10.5. TEM images of (D) LHES-B and (E) LHES nanoparticles under acidic condition (pH = 4.5). Scale bar is 200 nm. (F) Drug loading efficiency of LHES-B nanoparticles stored at 30 °C was tested on day 2, 4, 6, 8, and 10. |
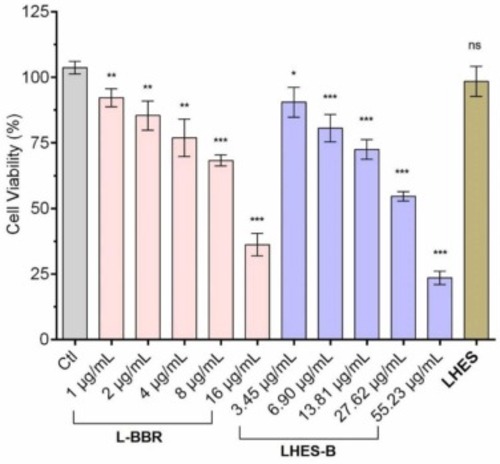
Cell viability of HepG2 cells after incubating with different concentrations of L-BBR (1, 2, 4, 8, and 16 µg/mL), LHES-B (3.45, 6.90, 13.81, 27.62, and 55.23 µg/mL, the concentrations of L-BBR in medium were 1, 2, 4, 8, and 16 µg/mL), and LHES carriers (50 µg/mL) for 24 h. The data were analyzed by one-way ANOVA followed by Tukey's test using the Graph Pad Prism 7.0 software. The results were expressed as mean ± SD, *P<0.05, **P<0.01, ***P<0.001 VS Ctl. |
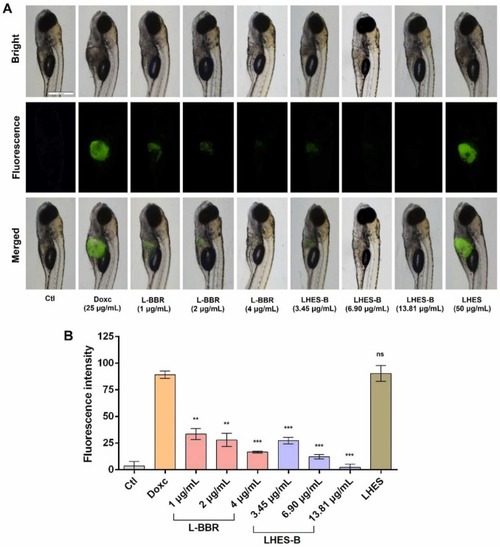
(A) Bright and fluorescence images of zebrafish and (B) fluorescence intensity in zebrafish liver after incubating with Doxc (25 μg/mL) and tested samples for 4 days. Tested samples included L-BBR (1, 2, and 4 µg/mL), LHES-B (3.45, 6.90, and 13.81 µg/mL, the concentrations of L-BBR in medium were 1, 2, and 4 µg/mL), and LHES carriers (50 µg/mL). Scale bar is 500 μm. The data were analyzed by one-way ANOVA followed by Tukey's test using the Graph Pad Prism 7.0 software. The results were expressed as mean ± SD, **P<0.01, ***P<0.001 VS Doxc. |