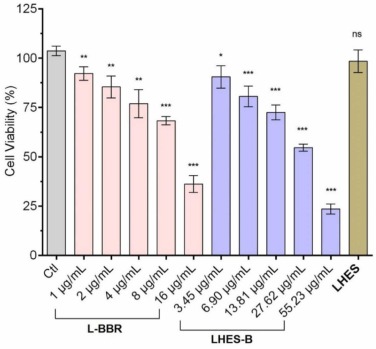
Image


                        Figure Caption


Fig. 7 Cell viability of HepG2 cells after incubating with different concentrations of L-BBR (1, 2, 4, 8, and 16 µg/mL), LHES-B (3.45, 6.90, 13.81, 27.62, and 55.23 µg/mL, the concentrations of L-BBR in medium were 1, 2, 4, 8, and 16 µg/mL), and LHES carriers (50 µg/mL) for 24 h. The data were analyzed by one-way ANOVA followed by Tukey's test using the Graph Pad Prism 7.0 software. The results were expressed as mean ± SD, *P<0.05, **P<0.01, ***P<0.001 VS Ctl.
                
                    
                        Acknowledgments


This image is the copyrighted work of the attributed author or publisher, and
ZFIN has permission only to display this image to its users.
Additional permissions should be obtained from the applicable author or publisher of the image.
      Full text @ Biomed. Pharmacother.


        