
- Title
-
Design and Application of Cu2+ Fluorescent Sensor Based on Carbazole Derivatives
- Authors
- Li, T., Xiao, X., Zhou, C., Luo, M.
- Source
- Full text @ J. Fluoresc.
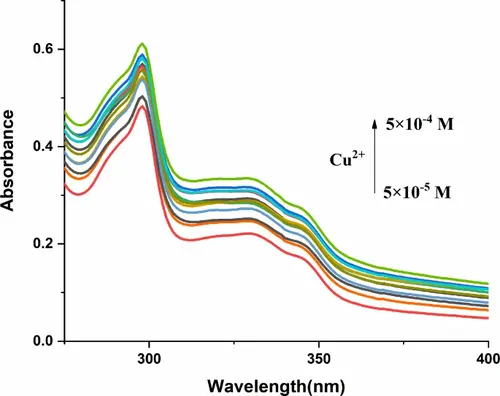
UV-vis absorption response of Sensor 1 in different concentrations of Cu2 + in HEPES − NaOH buffer (pH = 7.4) − DMF(1/1, v/v) |

Fluorescence spectrum of Sensor 1 in different metal ions in HEPES − NaOH buffer (pH = 7.4) − DMF(1/1, v/v) ( λex = 298 nm, slits: 2.5 nm/2.5 nm) |
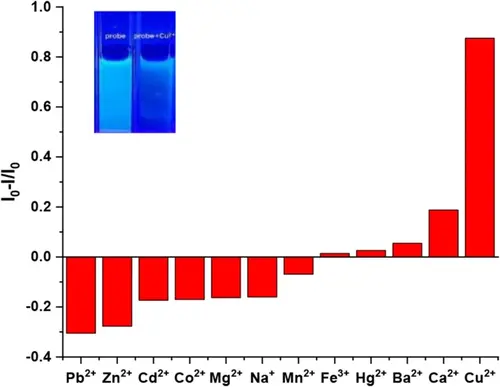
Characterization of fluorescence quenching of Sensor 1 in different metal ions in HEPES − NaOH buffer (pH = 7.4) − DMF(1/1, v/v) at 365 nm in the fluorescence emission spectrum ( λex = 298 nm, λem = 365 nm, slits: 2.5 nm/2.5 nm) |
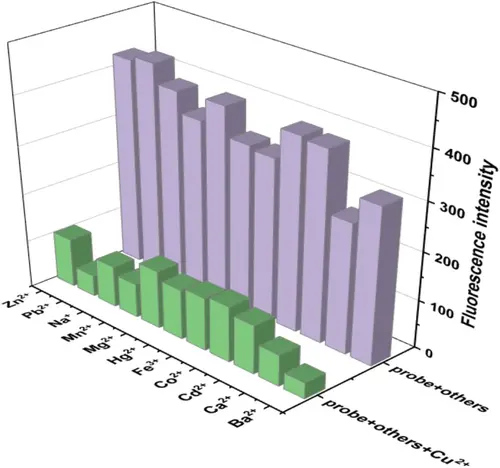
Histograms of fluorescence selective experiments (purple) and competitive experiments (green) of Sensor 1 in different metal ions in HEPES − NaOH buffer (pH = 7.4) − DMF(1/1, v/v) at 365 nm in the fluorescence emission spectrum ( λex = 298 nm, λem = 365 nm, slits: 2.5 nm/2.5 nm) |
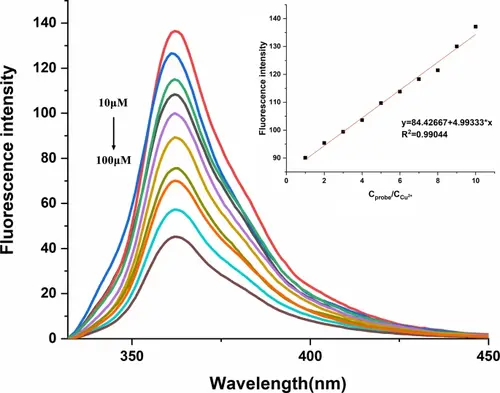
Fluorescence response of Sensor 1 to Cu2+ in different concentrations in HEPES − NaOH buffer (pH = 7.4) − DMF(1/1, v/v) ( λex = 298 nm, λem = 365 nm, slits: 2.5 nm/2.5 nm) |
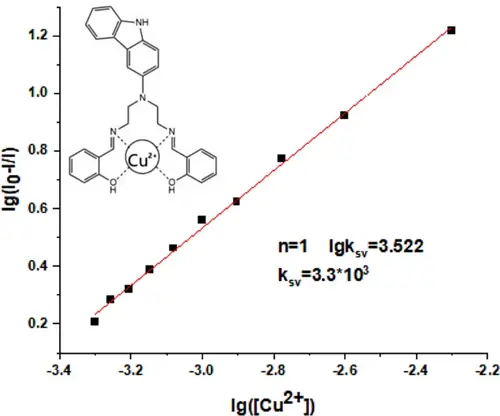
The linear fitting of the fluorescence titration curve of Sensor 1 in HEPES − NaOH buffer (pH = 7.4) − DMF(1/1, v/v) at 365 nm in the fluorescence emission spectrum ( λex = 298 nm, λem = 365 nm, slits: 2.5 nm/2.5 nm) and the combined model diagram between Sensor 1 and Cu2+ |
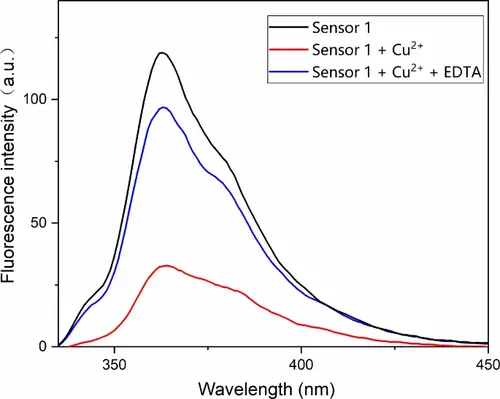
Fluorescence spectra of 0.1 mM Sensor 1 in the presence of 0.1 mM Cu2+ and 0.3 mM EDTA in HEPES − NaOH buffer (pH = 7.4) − DMF(1/1, v/v) at 365 nm in the fluorescence emission spectrum ( λex = 298 nm, slits: 2.5 nm/2.5 nm) |
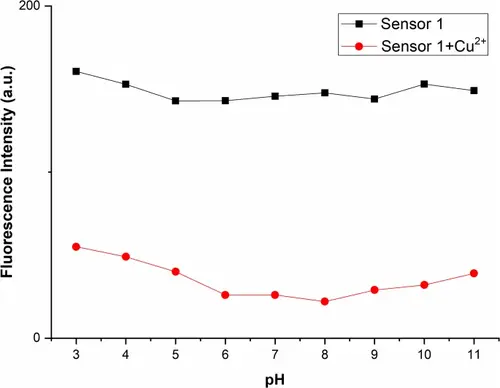
Fluorescence intensity of Sensor 1 ( 0.1 mM ) measured with and without Cu2+ ions ( 0.1 mM ) as a function of pH in HEPES − NaOH buffer (pH = 7.4) − DMF(1/1, v/v) at 365 nm in the fluorescence emission spectrum ( λex = 298 nm, λem = 365 nm, slits: 2.5 nm/2.5 nm) |
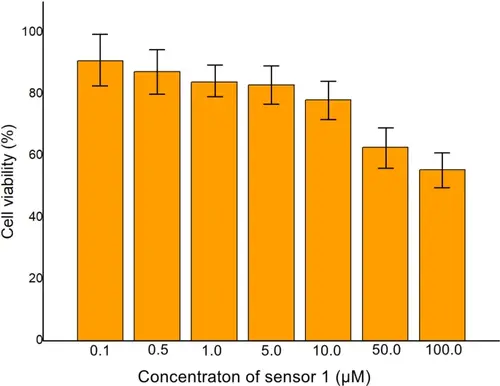
Concentration-dependent cell viability assay |
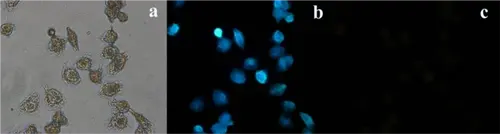
(a) Bright-field transmission image of HeLa cells treated with Sensor 1; (b) Fluorescence imaging of HeLa cells treated with Sensor 1;(c) Fluorescence imaging of HeLa cells treated with Sensor 1-Cu2+ |
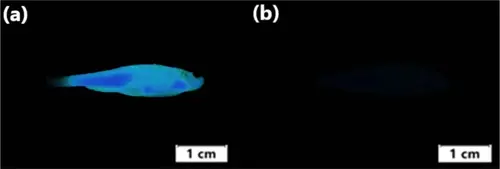
Images of zebrafish under UV light at 365 nm: (a) Zebra fish bred with only Sensor 1 for 1 h; (b) Fish bred with Sensor 1 and then bred with Cu2+ for 1 h |