
Image
|
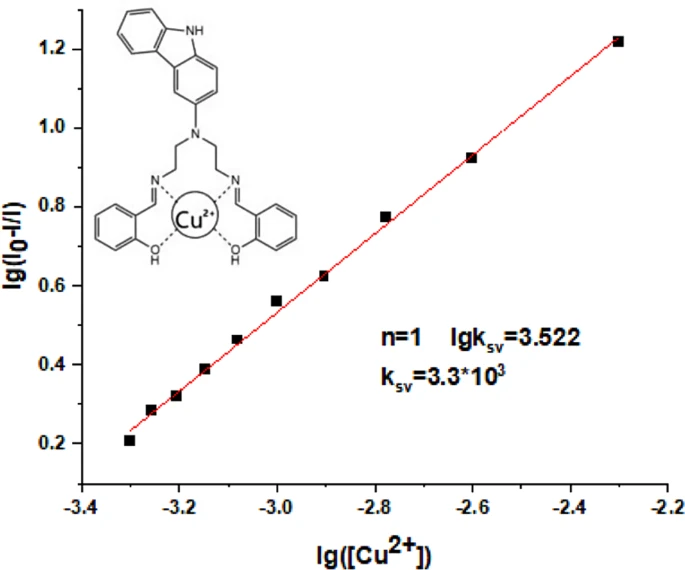
Figure Caption
Fig. 6 The linear fitting of the fluorescence titration curve of Sensor 1 in HEPES − NaOH buffer (pH = 7.4) − DMF(1/1, v/v) at 365 nm in the fluorescence emission spectrum ( λex = 298 nm, λem = 365 nm, slits: 2.5 nm/2.5 nm) and the combined model diagram between Sensor 1 and Cu2+
Acknowledgments
This image is the copyrighted work of the attributed author or publisher, and
ZFIN has permission only to display this image to its users.
Additional permissions should be obtained from the applicable author or publisher of the image.
Full text @ J. Fluoresc.