FIGURE SUMMARY
Title

Effect of Probiotics in Stress-Associated Constipation Model in Zebrafish (Danio rerio) Larvae

Authors
Lee, A., Kim, S.Y., Kang, S., Kang, S.H., Kim, D.W., Choe, J.W., Hyun, J.J., Jung, S.W., Jung, Y.K., Koo, J.S., Yim, H.J., Kim, S.
Source
Full text @ Int. J. Mol. Sci.

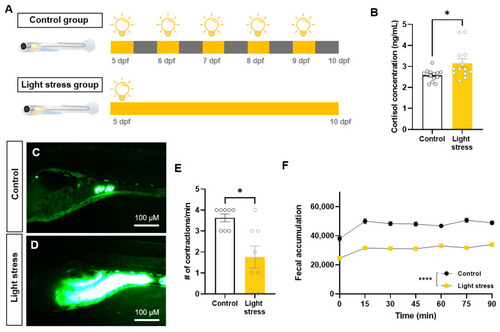
Constant light exposure causes stress and constipation in zebrafish larvae. (A) Schematic illustration showing experimental design. (B) Comparison of cortisol concentration between the control and light-stress groups (n = 13). (C,D) Lateral images of the fluorescent tracer in the intestinal tracts of zebrafish larvae. Scale bar: 100 μM. (E) Comparison of the number (#) of intestinal contractions in zebrafish larvae (n = 8). (F) Fluorescence spectrophotometer of fecal accumulation over time (n = 3). Each replicate had 45 zebrafish embryos. * p < 0.05; **** p < 0.0001.

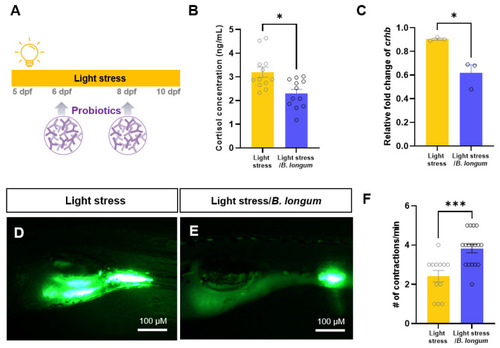
Probiotic intakes reduced stress response and constipation in zebrafish larvae. (A) Schematic illustration showing experimental design. Larvae were fed Bifidobacterium longum subsp. longum probiotic-based food on 6 and 8 dpf during constant light exposure. (B) Comparison of cortisol concentration between light-stress group and probiotic-feeding light-stress group (n = 12). (C) Relative fold change of crhb mRNA expression (n = 3). Each replicate had 20 zebrafish embryos. (DF) Lateral images of the fluorescent tracer in the intestinal tracts of zebrafish larvae. Scale bar: 100 μM. (F) Comparison of the number (#) of intestinal contractions in zebrafish larvae. n = 12 for light-stress group, n = 17 for light-stress/B. longum group. * p < 0.05; *** p < 0.001.

Probiotics reduced inflammatory cell recruitment by constant light exposure. (A,C,E) In vivo intestinal images of 10 dpf Tg (mpeg1:gal4vp16;uas:egfp) show macrophage infiltration. Scale bar: 100 μM. (B,D,F) In vivo intestinal images of 10 dpf Tg (mpx:mcherry) show neutrophil infiltration. Arrows indicate neutrophils in the intestine. Scale bar: 100 μM. (A,B) Control group. (C,D) Stress-induced group by constant light exposure. (E,F) B. longum-feeding stress-induced group. (G) Comparison of the number (#) of intestine-infiltrated macrophages among all groups: n = 16 for control group; n = 21 for light-stress group; n = 13 for light-stress/B. longum group. (H) Comparison of the number (#) of intestine-infiltrated neutrophils among all groups: n = 18 for control group; n = 21 for light-stress group; n = 21 for light-stress/B. longum group. (I) Relative fold changes of inflammatory genes, including tnfα, nfkb, il1b, and il6 (n = 4). Each replicate had 20 zebrafish embryos. ns, not significant; * p < 0.05; ** p < 0.01; *** p < 0.001; **** p < 0.0001.

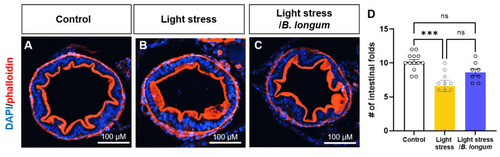
Inflammation induced by stress affects intestinal folds. (AC) Cross-sectional images of 10 dpf larvae labeled with phalloidin (red) and DAPI (blue). Scale bar: 100 μM. (D) Comparison of the number (#) of intestinal folds of mid-intestines among all groups: n = 13 for control group; n = 10 for light-stress group; n = 8 for light-stress/B. longum group. ns, not significant; *** p < 0.001.

Inflammation-induced activity of enteric neurons. (AC) Intestinal images of 10 dpf larvae labeled with anti-Hu (green) and anti-5-HT (red) antibodies. Arrows indicate 5-HT+/Hu+ neurons in the intestine. Scale bar: 50 μM. (DF) Intestinal images of 10 dpf larvae labeled with anti-Hu (green) and anti-pERK (red) antibodies. Arrows indicate pERK+/Hu+ neurons in the intestine. Scale bar: 50 μM. (G) Comparison of the number (#) of Hu+ enteric neurons among all groups: n = 25 for control group; n = 30 for light-stress group; n = 38 for light-stress/B. longum group. (H) Comparison of the number (#) of 5-HT+/Hu+ serotonin enteric neurons among all groups: n = 12 for control group; n = 17 for light-stress group; n = 15 for light-stress/B. longum group. (I) Comparison of the number (#) of pERK+/Hu+ enteric neurons among all groups: n = 13 for control group; n = 20 for light-stress group; n = 21 for light-stress/B. longum group. ns, not significant; * p < 0.05; ** p < 0.01.

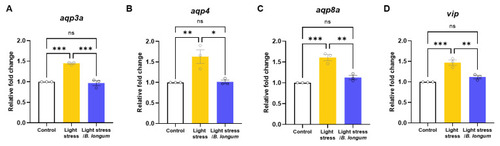
Probiotics relieve stress-induced constipation by affecting intestinal water metabolism. Relative fold changes in aqp3a (A), aqp4 (B), aqp8a (C), and vip (D) mRNA expressions (n = 3). Each replicate had 20 zebrafish embryos. ns, not significant; * p < 0.05; ** p < 0.01; *** p < 0.001.

Acknowledgments
This image is the copyrighted work of the attributed author or publisher, and ZFIN has permission only to display this image to its users. Additional permissions should be obtained from the applicable author or publisher of the image. Full text @ Int. J. Mol. Sci.