
- Title
-
Hypolipidemic Effect of Rice Bran Oil Extract Tocotrienol in High-Fat Diet-Induced Hyperlipidemia Zebrafish (Danio Rerio) Induced by High-Fat Diet
- Authors
- Liu, N., Zhang, P., Xue, M., Zhang, M., Huang, Z., Xu, C., Meng, Y., Fan, Y., Liu, W., Zhang, F., Chen, P., Zhou, Y.
- Source
- Full text @ Int. J. Mol. Sci.
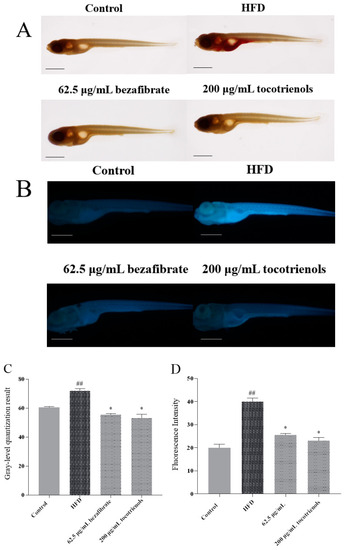
Tocotrienol can reduce the triglyceride and cholesterol contents in zebrafish larvae. ( |
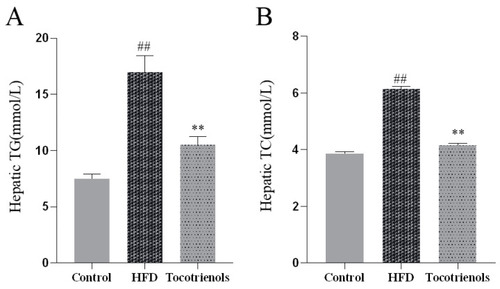
Tocotrienol can reduce the contents of triglyceride and cholesterol in the liver of adult zebrafish. ( |
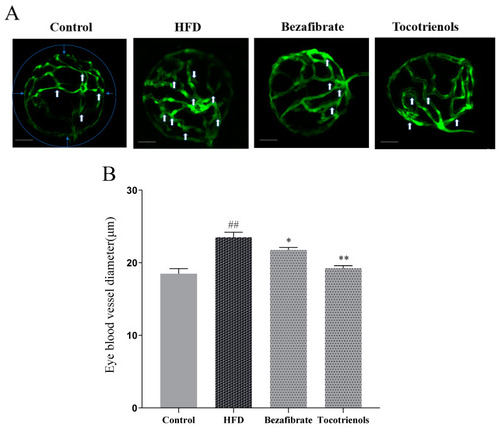
Changes in intraocular blood vessels in the zebrafish lens. ( |
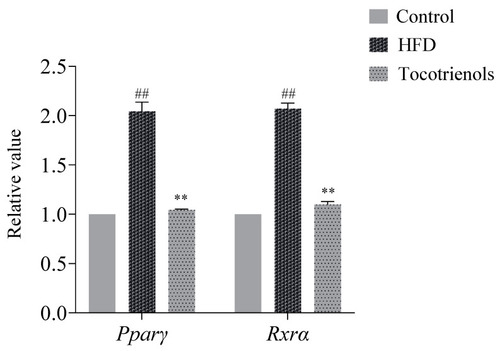
The expression levels of the |
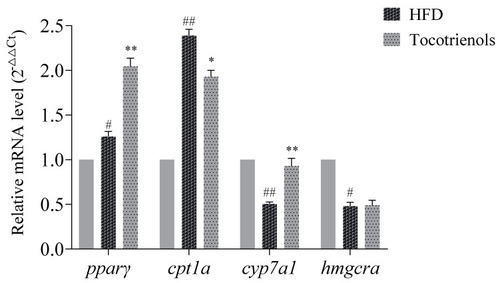
Liver lipid metabolism-related gene mRNA expression. # indicates that, compared to the blank control group, |
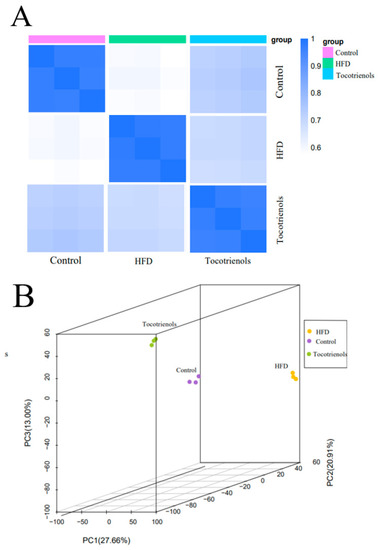
Results of the lipid analysis in the adult zebrafish liver. ( |
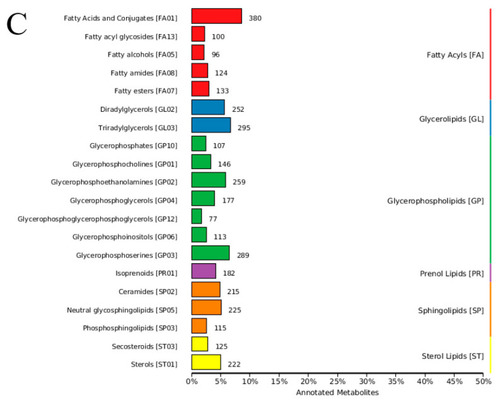
Results of the lipid analysis in the adult zebrafish liver. ( |
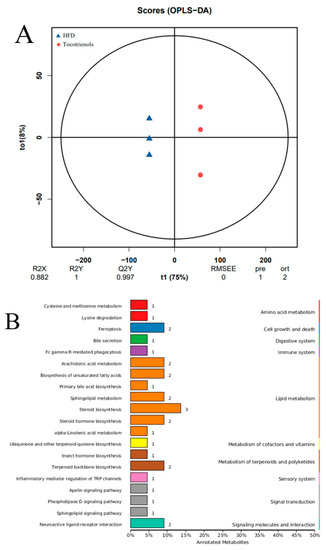
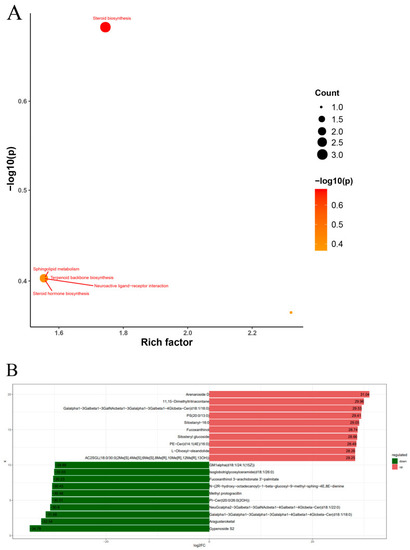
Differential lipid analysis between the HFD group and tocotrienol group. ( |
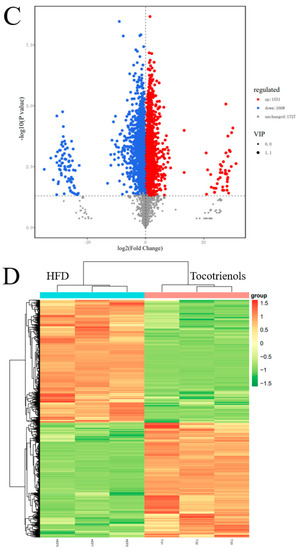
Differential lipid analysis between the HFD group and tocotrienol group. ( |
( |