
- Title
-
Petrosamine isolated from marine sponge Petrosia sp. demonstrates protection against neurotoxicity in vitro and in vivo
- Authors
- Ribeiro, J., Araújo-Silva, H., Fernandes, M., da Silva, J.A., Pinto, F.D.C.L., Pessoa, O.D.L., Santos, H.S., de Menezes, J.E.S.A., Gomes, A.C.
- Source
- Full text @ Nat Prod Bioprospect

Chemical structure of petrosamine |

Biocompatibility of petrosamine. |

Evaluation of neuroprotection conferred by petrosamine in SH-SY5Y cell line exposed to AlCl3 for 24 h, measured by resazurin assay. Percentages are expressed relative to the life control (100% cell viability). Death control (30% DMSO). *p < 0.05, **p < 0.01, ***p < 0.001, ****p < 0.0001 when compared to the life control |
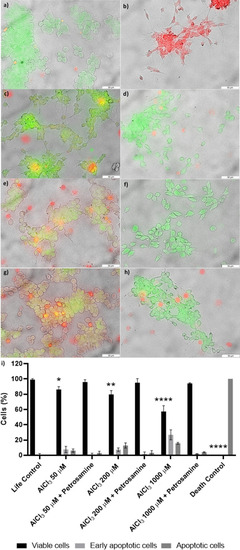
Fluorescence microscopy of acridine orange (AO)/propidium iodide (PI) assay showing SH-SY5Y cells exposed to different concentrations of AlCl3 for 24 h. |
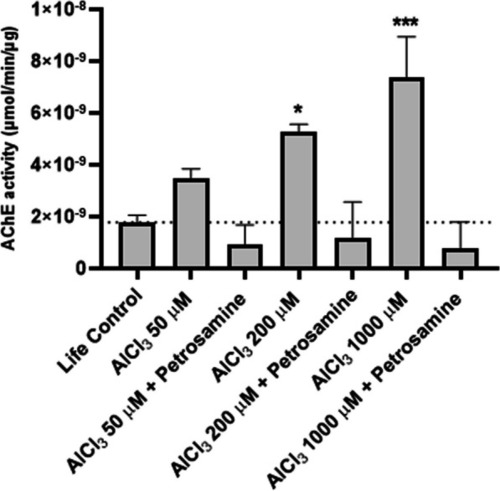
Activity of acetylcholinesterase (AChE) enzyme in SH-SY5Y cell line after 24 h of incubation with AlCl3 and further 24 h of petrosamine incubation. * p < 0.05 and *** p < 0.001 when compared to the life control |
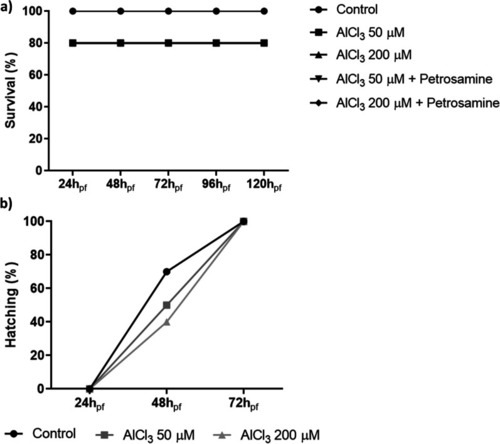
Analysis of zebrafish embryo development during embryotoxicity assay. |

Epiboly of zebrafish embryos exposed to 50 and 200 µM of AlCl3 at 6 hpf. *p < 0.05 and ***p < 0.001 when compared to the control |
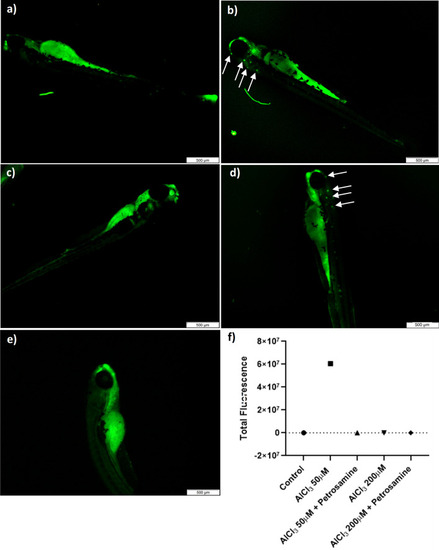
Acridine orange (AO) staining in whole body zebrafish larvae with 120 hpf.; |
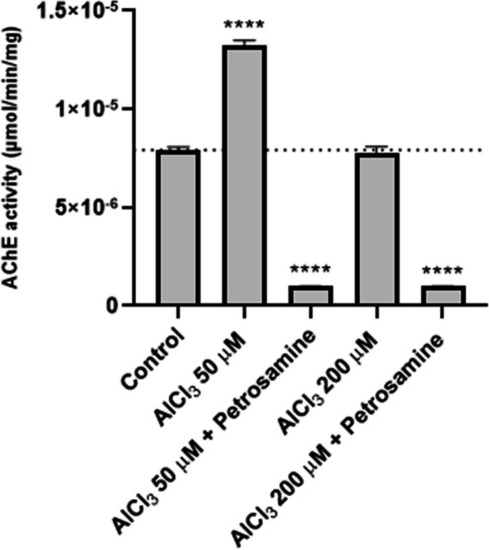
AChE activity of whole 120 hpf embryo, after exposure to two different concentrations of AlCl3 (50 µM and 200 µM) during 72 hpf and then treated with petrosamine (0.05 mg/ml) until 120 hpf. Statistical significance as compared to life control, ****p < 0.0001 |