
- Title
-
Replacement of Dietary Fish Protein with Bacterial Protein Results in Decreased Adiposity Coupled with Liver Gene Expression Changes in Female Danio rerio
- Authors
- Williams, M.B., Green, G.B., Palmer, J.W., Fay, C.X., Chehade, S.B., Lawrence, A.L., Barry, R.J., Powell, M.L., Harris, M.L., Watts, S.A.
- Source
- Full text @ Curr Dev Nutr
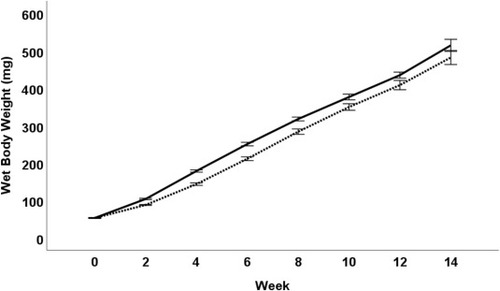
Total body weight average for tanks of fish (mg) for male and female zebrafish (combined) fed either BP (black line) or SR (dashed line) protein diets measured every 2 wk from week 2 to week 14 on the assigned diets (n = 10 tanks, 14 fish per tank for each diet treatment). P value represents linear regression of the trend line. BP, bacterial protein; SR, standard reference. |

Terminal wet body weight (mg; A), standard length (mm; B), total body moisture (%; C), and dry body lipid (%; D) averages for individual fish for male and female zebrafish (separated) measured at termination at 14 wk on the assigned diets (n = 10 tanks, 14 fish per tank for each diet treatment). |

Total egg produced (A), egg viability at 4 hpf (B), and egg viability at 24 hpf (C) averages for breeding of female zebrafish after 14–18 wk on the assigned diets crossed with males fed Artemia (n = 20 breeding events for female of the dietary treatments with a 2-wk gap). |

Principal component analysis (PCA) among samples, red dots represent the female D. rerio fed with the fish protein hydrolysate diet [standard reference (SR)], and the blue dots represent the female D. rerio fed with the single-cell bacterial protein (BP) diet. The PCA plot was generated via DeSeq2 (ver. 1.22.2). |
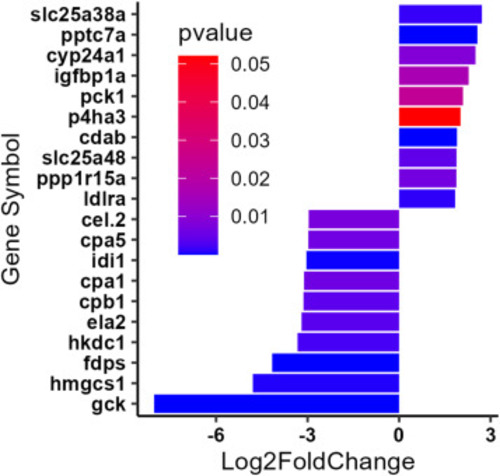
The top 10 upregulated and top 10 downregulated differentially expressed genes (DEGs). The genes were selected after differential expression analysis (DeSeq2), and were filtered based on a BaseMean > 500, log2FC > |1.5| and a P value < 0.1. |
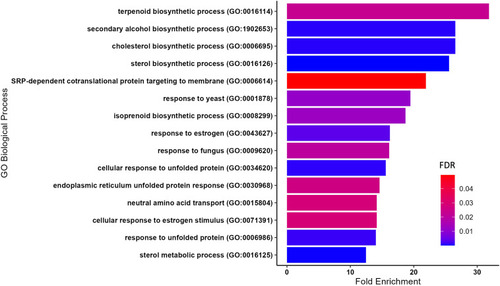
Top 15 most significantly enriched gene ontologies (Gene Ontology, released 3 January, 2023) based on the highest fold enrichment, and a FDR < 0.05, were plotted in R, using ggplot2 (v3.4.0). FDR, false discovery rate. |
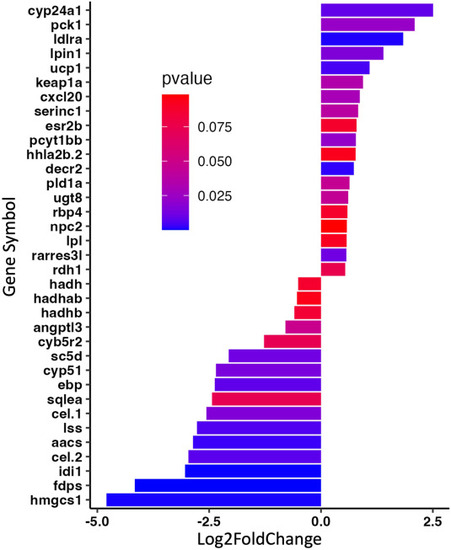
Genes associated with lipid-related pathways determined via GO analysis. These pathways were: “sterol biosynthetic bioprocess,” “response to lipid,” “fatty metabolic process,” sterol metabolic process,” “lipid metabolic process,” “fatty acid catabolic process,” and “lipid biosynthetic process.” Genes with a log2foldchange > |1.5|, and a P value < 0.1 were plotted via a ggplot2 (v.3.4.0). GO, gene ontology. |
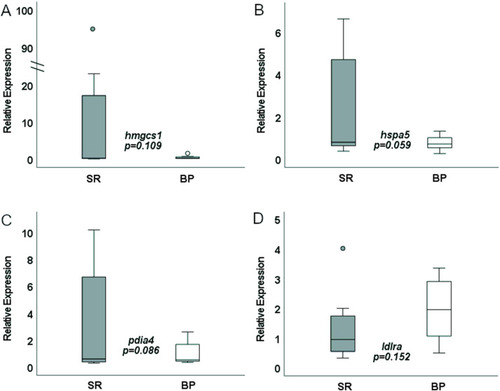
rtPCR liver expression of SR- and BP-fed females (n = 8 livers). BP, bacterial protein; SR, standard reference. |
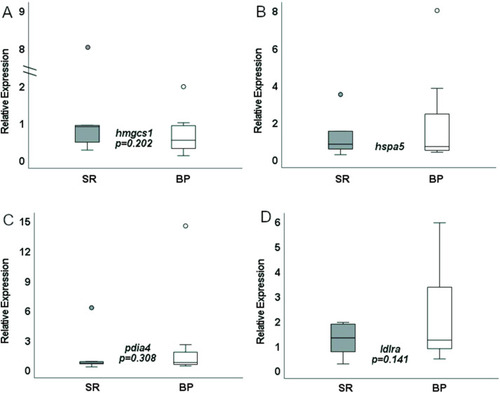
rtPCR liver expression of SR- and BP-fed males (n = 5–7 livers). BP, bacterial protein; SR, standard reference. |