
Image
|
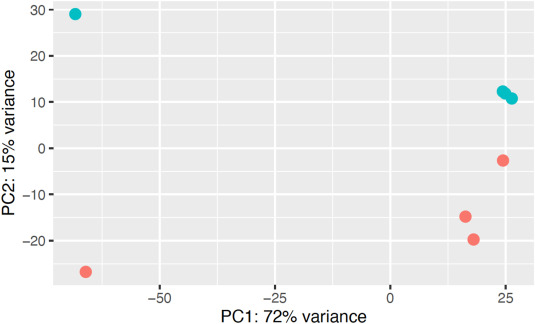
Figure Caption
Fig. 4 Principal component analysis (PCA) among samples, red dots represent the female D. rerio fed with the fish protein hydrolysate diet [standard reference (SR)], and the blue dots represent the female D. rerio fed with the single-cell bacterial protein (BP) diet. The PCA plot was generated via DeSeq2 (ver. 1.22.2).
Acknowledgments
This image is the copyrighted work of the attributed author or publisher, and
ZFIN has permission only to display this image to its users.
Additional permissions should be obtained from the applicable author or publisher of the image.
Full text @ Curr Dev Nutr