FIGURE SUMMARY
Title

Modulation of Zebrafish (Danio rerio) Intestinal Mucosal Barrier Function Fed Different Postbiotics and a Probiotic from Lactobacilli

Authors
Rawling, M., Schiavone, M., Mugnier, A., Leclercq, E., Merrifield, D., Foey, A., Apper, E.
Source
Full text @ Microorganisms

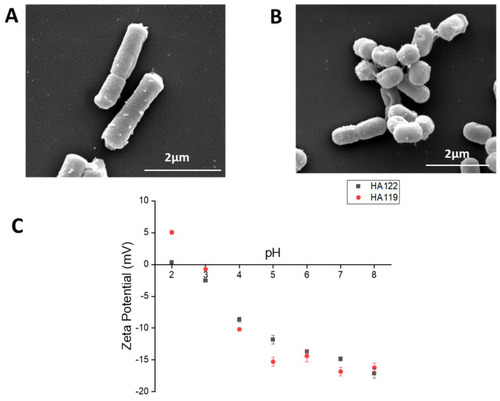
Morphology and surface charge of LHPost and LPPost. (A,B) Scanning electronic images of two cells of LHPro and LHPost revealing extracellular membrane vesicles at the proximal of the cell wall (C) Zeta-potential measurements (mV) of LHPost and LPPost at different pH.

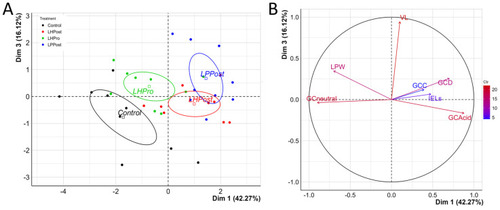
Elevated phenotypic markers showing the fortification of the mucosal barrier in fish fed diets supplemented with postbiotics compared to other treatments. (A) PCA plot of individuals and their distribution that was significantly affected by the mucosal barrier protection variables as indicated in plot B. Confidence ellipses were drawn around the levels of the categorical variables for treatment status with a confidence level of 0.95. (B) Variables plot showing the highest (red) to lowest (blue) contribution of mucosal barrier protection variables affecting the distribution of individuals, as shown in PCA plot A. Specific terms on plot B are: GCneutral = neutral mucin goblet cells; GCAcid = acidic mucin goblet cells; GCC = goblet cell coverage; GCD = goblet cell density; IELs = intraepithelial leukocytes, LPW = lamina propria width, and VL = villi length.

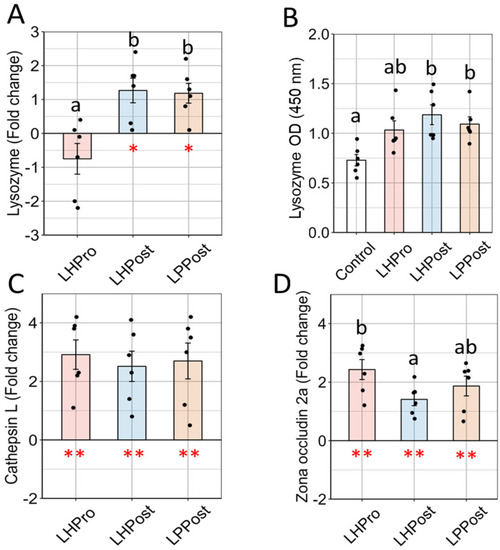
Gene expression analysis revealed positive elevations in markers, suggesting a fortification of the mucosal barrier in fish fed diets supplemented with postbiotics compared to other groups. (A) Lysozyme gene expression (fold change relative to the control (Log2)); (B) Lysozyme; (C) Cathepsin L and (D) Tight junction protein zona occluding 2a gene expression. Data are presented as means ± SEM. Asterisks denote significance in gene transcription compared to the control diet (* p < 0.05; ** p < 0.01). Different letters denote significant differences in gene transcription among the three diets (LHPro, LHPost, and LPPost) for each target gene (p < 0.05).

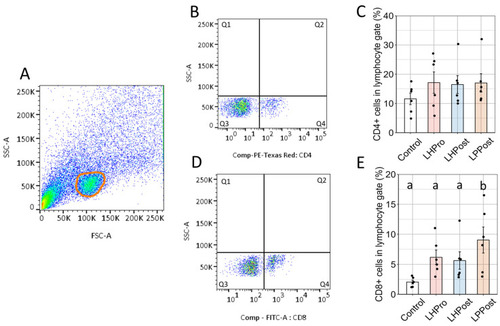
Mobilization of positive CD8α+ cells in the posterior intestine of zebrafish fed probiotic and postbiotic treatments. (A) Lymphocyte gate; (B) positive CD4 cells as indicated by population in Q4; (C) prevalence of positive CD4 cells in the lymphocyte gate; (D) positive CD8 cells as indicated by population in Q4; (E) prevalence of positive CD8 cells in the lymphocyte gate. Data are presented as the mean ± SEM; different letters indicate significant difference between experimental groups (Tuckey post-hoc test; p < 0.05).

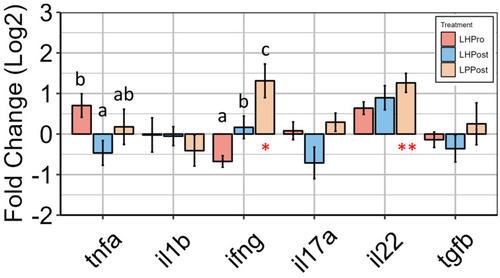
Gene expression analysis reveals the modulation of innate immune effector cytokines by postbiotic groups in the posterior intestine of zebrafish. Relative expression level (fold change (Log2)) to the control group of innate immune markers is shown. Data are presented as mean ± SEM. Symbols in red denote significance in gene expression compared to the control group (* p < 0.05; ** p < 0.01). Letters denote significant differences in gene expression among the experimental groups (LHPro, LHPost, and LPPost) for each target gene (p < 0.05).

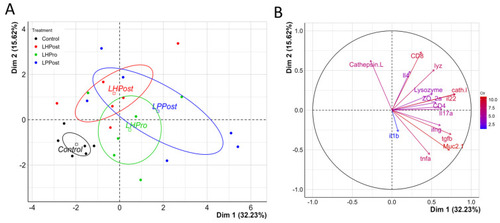
Positive differentiation of immune response markers as shown by principal component analysis. (A) PCA plot of individuals and their distribution that was significantly affected by the immune response variables as indicated in (B). Confidence ellipses drawn around the levels of the categorical variables for treatment status with a confidence level of 0.95; variables plot showing the highest (red) to lowest (blue) contribution of variables to the PCA plot (A). Cathepsin L and Lysozyme indicate markers measured by ELISA; immune gene expression markers are indicated in lower case; CD8 and CD4 indicated specific T-cell markers for adaptive immune cell phenotypes (CD8α+ and CD4+ cells, respectively); tight junction and mucus biomarkers were indicated by ZO- 2a and Muc2.1, respectively.

Acknowledgments
This image is the copyrighted work of the attributed author or publisher, and ZFIN has permission only to display this image to its users. Additional permissions should be obtained from the applicable author or publisher of the image. Full text @ Microorganisms