FIGURE SUMMARY
Title

asb5a/asb5b Double Knockout Affects Zebrafish Cardiac Contractile Function

Authors
Cai, W., Wang, Y., Luo, Y., Gao, L., Zhang, J., Jiang, Z., Fan, X., Li, F., Xie, Y., Wu, X., Li, Y., Yuan, W.
Source
Full text @ Int. J. Mol. Sci.

Schematic diagrams of asb5a gene knockout in zebrafish. (A) Schematic diagram of sgRNA targeting for asb5a gene knockout. Green horizontal line represents the genomic DNA of asb5a, green rectangle represents the exons of asb5a, red font represents the target site sequence, and blue font represents the protospacer adjacent motif (PAM). (B) Schematic diagram of the three heritable mutant alleles of asb5a produced via gene knockout and their encoded protein sequences. (C) Sequencing peak diagram of three asb5a mutant alleles, in which bases A, G, C, and T are represented by green, black, blue, and red curves, respectively.

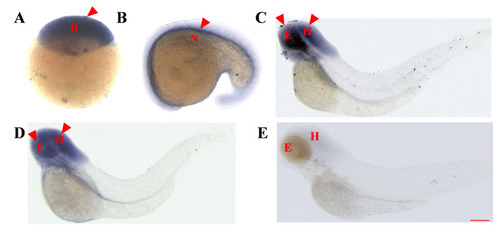
Temporal and spatial expression patterns of the asb5a gene in zebrafish embryos determined through whole-embryo in situ hybridization. (A) High blastocyst stage (3.3 hpf), with ubiquitous expression. (B) At the 21-somite stage (19.5 hpf), asb5a is expressed in the notochord region. (C) At 48 hpf, high expression of asb5a is concentrated in the eyes and head area, with low expression in the tail. (D) At 3 dpf, asb5a is highly expressed in the head and the eyes. (E) At 4 dpf, asb5a expression is downregulated in the eye and head regions. hpf: hours postfertilization; dpf: days postfertilization; B: blastocyst; N: notochord; E: eyes; H: head. Scale bar: 1 mm.

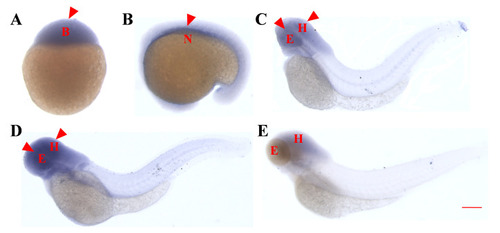
Temporal and spatial expression pattern of the asb5b gene in zebrafish embryos determined through whole-embryo in situ hybridization. (A) High blastocyst stage (3.3 hpf), with ubiquitous expression. (B) At the 21-somite stage (19.5 hpf), asb5b is expressed in the notochord region. (C) At 48 hpf, high expression of asb5b is concentrated in the eyes and head area, with low expression in the tail. (D) At 3 dpf, asb5b is highly expressed in the head and the eyes. (E) At 4 dpf, asb5b expression is downregulated in the eyes and head regions. B: blastocyst; N: notochord; E: eyes; H: head. Scale bar: 1 mm.

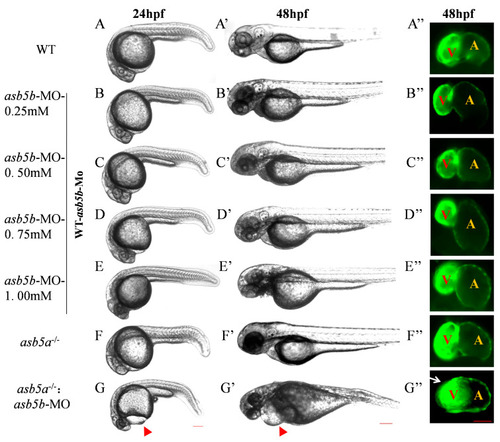
Effects of asb5b-ATGmo knockdown on zebrafish heart development. (AG) Pericardial cavities of different groups when embryos had developed to 24 hpf. Scale bar: 200 µm. (A′G′) Pericardial cavities of different groups when embryos had developed to 48 hpf. Scale bar: 200 µm. (A″G″) For zebrafish on the myl7:EGFP background (myl7:EGFP transgenic zebrafish indicates EGFP is specially expressed in the heart, see Section 4.1), an atrium (A) and ventricle (V) from each group is shown at the point when the embryos had developed to 48 hpf. Red triangular arrows indicate the enlarged area around the cardiac cavity, and a white arrow indicates the atrial expansion area. Scale bar: 50 µm.

Effects of asb5a−/−:asb5b-ATGmo double-knockout on the transcriptome of zebrafish at 48 hpf. (AC) Volcano plot of differentially expressed genes (DEGs). Blue dots represent downregulated genes, red dots represent upregulated genes, and gray dots represent genes with no significant expression differences under different conditions (significance threshold: |log2FC| > 2.0 and p < 0.05). (DF) Heatmap of DEGs, where rows and columns represent genes and samples, respectively. Red and blue indicate high and low expression levels, respectively. Darker colors denote more pronounced significant differences.

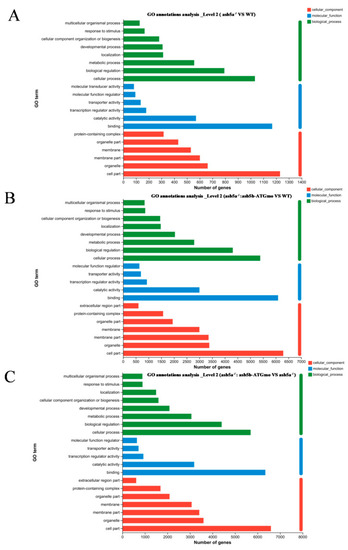
Effects of asb5a−/−:asb5b-ATGmo double-knockout on Gene Ontology (GO) enrichment analysis of zebrafish at 48 hpf. GO enrichment analysis of DEGs includes molecular functions (MFs), biological processes (BPs), and cellular components (CCs). GO enrichment analysis results are shown for (A) the asb5a−/− group compared with the wild-type (WT) group, (B) the asb5a−/−:asb5b-ATGmo double-knockout group compared with the WT group, and (C) the asb5a−/−:asb5b-ATGmo double-knockout group compared with asb5a−/− group.

Effect of asb5a−/−:asb5b-ATGm double-knockout on Kyoto Encyclopedia of Genes and Genomes (KEGG) pathway enrichment analysis of zebrafish at 48 hpf. KEGG pathway enrichment analysis of DEGs includes only the top 20 functional entries. (A) KEGG pathway enrichment analysis results for the asb5a−/−:asb5b-ATGmo double-knockout group compared with the WT group. (B) KEGG pathway enrichment analysis in the asb5a−/−:asb5b-ATGmo double-knockout group compared with the asb5a−/− group. Purple box represents KEGG pathway enriched in cardiac muscle contraction function entries.

M-mode revealed cardiac physiological functions after asb5a/asb5b inactivation. The 10 s M-modes clearly displayed various physiological and functional indicators. (A) Compared with the WT group, the asb5a−/−:asb5b-ATGmo double-knockout group showed prolonged HP, SI, and DI. (B) Heart rate statistical results. Compared with the WT group, heart rate in the single-gene-knockout group was significantly increased, whereas heart rate in the double-gene-knockout group was significantly decreased. (C) Statistical results of HP. Compared with the WT group, HP in the single-gene-knockout group was significantly shortened, whereas HP in the double-gene-knockout group was significantly increased. (D) Statistical results of SI. Compared with the WT group, there was no significant change in SI in the single-gene-knockout group, whereas SI in the double-gene-knockout group was significantly prolonged. (E) Statistical results of DI. Compared with the WT group, DI in the single-gene-knockout group was significantly shortened, whereas DI in the double-gene-knockout group was significantly prolonged. HP: heart period; SI: systolic interval; DI: diastolic interval; DD: diastolic diameter; SD: systolic diameter. Plotted data represent means ± standard error of the mean (SEM; n = 30). ns p > 0.05; * p < 0.05; ** p < 0.01; *** p < 0.001.

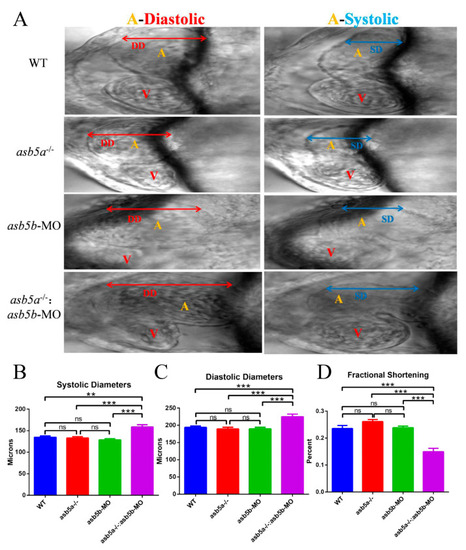
Atrial morphological changes after asb5a/asb5b inactivation. The 10 s M-mode screenshot clearly displayed the diastolic and systolic shapes of the atrium (A) and ventricle (V). (A) Morphological results. Compared with the other groups, the atrium tissue of the asb5a−/−:asb5b-ATGmo double-knockout group exhibited significantly longer DD and SD. (B) Statistical results of cardiac SD. Compared with the other groups, the SD of the asb5a−/−:asb5b-ATGmo double-knockout group was significantly increased. (C) Statistical results of DD. Compared with the other groups, the DD of the asb5a−/−:asb5b-ATGmo double-knockout group was significantly increased. (D) Statistical results of cardiac fractional shortening. Compared with the other groups, the cardiac fractional shortening in the asb5a−/−:asb5b-ATGmo double-knockout group was significantly reduced. DD: diastolic diameter; SD: systolic diameter. Plotted values represent means ± SEM (n = 30). nsp > 0.05; ** p < 0.01; *** p < 0.001 (unpaired t-test).

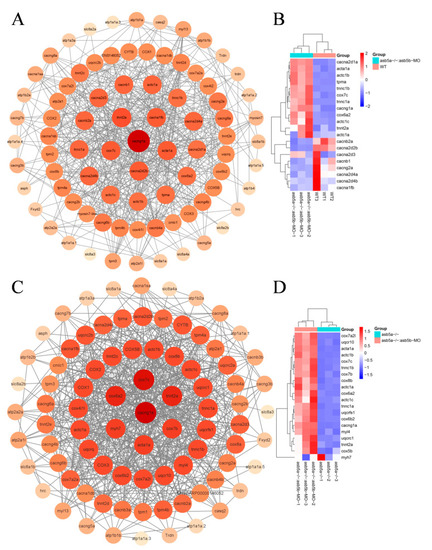
PPI network analysis and heatmap of the top 20 hub genes. (A) PPI regulatory network between the asb5a−/−:asb5b-ATGmo double-knockout and WT groups. All genes were enriched in cardiac contraction entries in KEGG, including 85 nodes and 499 edges. Larger circles and darker colors indicate higher degrees of connectivity. (B) Heatmap of the top 20 hub genes between the asb5a−/−:asb5b-ATGmo double-knockout and WT groups. (C) PPI regulatory network between the asb5a−/−:asb5b-ATGmo double-knockout and asb5a−/− groups. All genes enriched were in cardiac contraction entries in KEGG, including 86 nodes and 576 edges. Larger circles and darker colors indicate higher degrees of connectivity. (D) Heatmap of the top 20 hub genes between the asb5a−/−:asb5b-ATGmo double-knockout and asb5a−/− groups. Rows and columns represent genes and samples, respectively. Red and blue represent high and low expression levels, respectively. Darker colors indicate more pronounced differences.

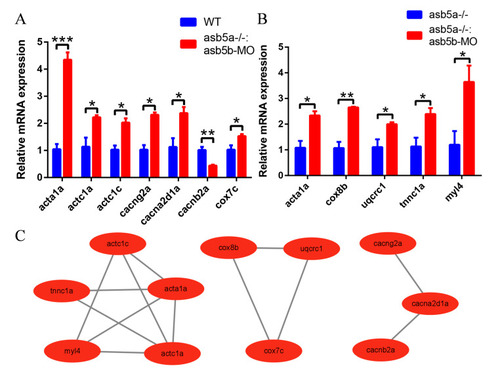
qPCR validation and the PPI network diagram. (A,B) Relative qPCR quantification of hub genes’ mRNA levels in zebrafish hearts at 48 hpf. Error bars indicate SEM. * p < 0.05; ** p < 0.01; *** p < 0.001 (N = 3 and n = 10; unpaired t-test). All genes were tested with 3 sample replicates (N = 3), each sample containing 10 embryos (n = 10). (C) PPI network containing three modules with 11 nodes and 13 edges.

Probable molecular regulatory mechanism of 11 hub genes affecting cardiac contractile function followingasb5a−/−:asb5b-ATGmo double-knockout. Green, pink, and blue ovals represent the three different control modules, respectively. Red and green arrows represent positive and negative regulation, respectively.

Acknowledgments
This image is the copyrighted work of the attributed author or publisher, and ZFIN has permission only to display this image to its users. Additional permissions should be obtained from the applicable author or publisher of the image. Full text @ Int. J. Mol. Sci.