FIGURE SUMMARY
Title

Antitumor Activity of Axitinib in Lung Carcinoids: A Preclinical Study

Authors
Dicitore, A., Gaudenzi, G., Carra, S., Cantone, M.C., Oldani, M., Saronni, D., Borghi, M.O., Grotteschi, J., Persani, L., Vitale, G.
Source
Full text @ Cancers

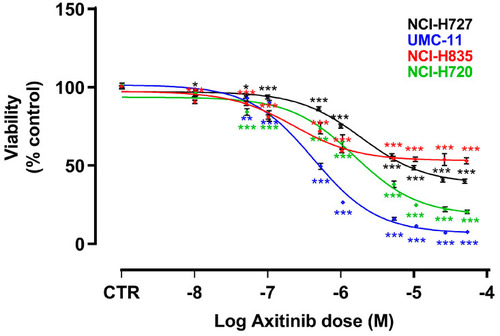
Effects of AXI on cell viability after 6 days of treatment. Dose response curves were generated after MTT (for NCI-H727 and UMC-11) or MTS (for NCI-H835 and NCI-H720) assays and are expressed as nonlinear regression (curve fit) of log (concentration drug) versus the percentage of vehicle control (CTR). Values represent the mean and S.E.M. of at least three independent experiments. * p < 0.05; ** p < 0.01; *** p < 0.001.

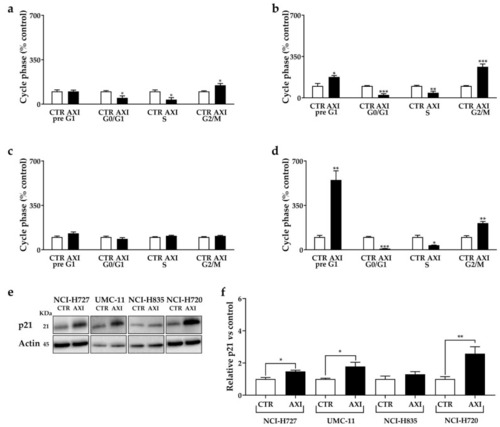
AXI modulation of cell cycle in NCI-H727 (a), in UMC-11 (b), in NCI-H835 (c) and NCI-H720 (d) after 3 days of incubation. Cell cycle distribution is expressed as the percentage of cells in G0/G1, S and G2/M phases compared to untreated control cells (CTR). CTR values have been set to 100%. Representative Western blot images (e) and relative quantifications (f) for the expression of p21 after 3 days of incubation with AXI compared to vehicle control (CTR) in lung carcinoid cell lines. * p < 0.05; ** p < 0.01; *** p < 0.001. The original western blot is Figure S3.

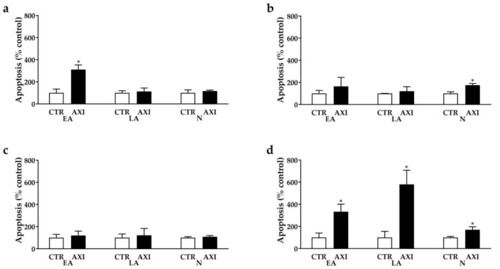
AXI perturbation of cell death in NCI-H727 (a), in UMC-11 (b), in NCI-H835 (c) and NCI-H720 (d) after 3 days of incubation. The proportions of early apoptotic cells (EA) and late apoptotic (LA) and necrotic cells (N) are expressed as percentage compared with the untreated control (CTR) and represent the mean and S.E.M. of at least 3 independent experiments. * p < 0.05.

Representative Western blot images (a) and relative quantifications for the expression of total (b) and cleaved PARP (c), total (d) and cleaved caspase 3 (e) after 3 days of incubation with AXI compared to vehicle control (CTR) in NCI-H727, UMC-11, NCI-H835 and NCI-H720 cells. Actin was used as a loading control. The intensity of each band was expressed as the ratio between the relative intensities of the bands associated with actin. Values represent means ± S.E.M from at least 3 independent experiments. * p < 0.05; ** p < 0.01. The original western blot is Figure S4.

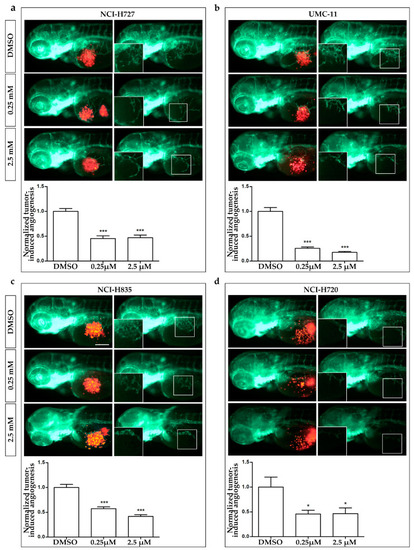
Effects of AXI treatments on tumor-induced angiogenesis in zebrafish embryos implanted with lung carcinoid cells. Representative epifluorescence images of Tg(fli1a:EGFP)y1 zebrafish embryos at 24 hpi, implanted with NCI-H727 (a), UMC-11 (b), NCI-H835 (c) and NCI-H720 (d) cells and treated with DMSO, as control, and 0.25 and 2.5 µM AXI. The red channel, corresponding to lung carcinoid cells, was omitted in the second column of each panel to highlight the tumor-induced microvascular network. Digital magnifications of graft regions are shown in white-boxed regions. Embryos are shown anterior to the left. Scale bar, 100 µm. In the bottom of each panel, the graph showed the quantification of tumor-induced angiogenesis in embryos implanted with lung carcinoid cells after 24 h of AXI treatment at 0.25 and 2.5 µM. Control (DMSO) values have been set to 1.0. Graphed values represent the mean ± S.E.M. * p < 0.05; *** p < 0.001.

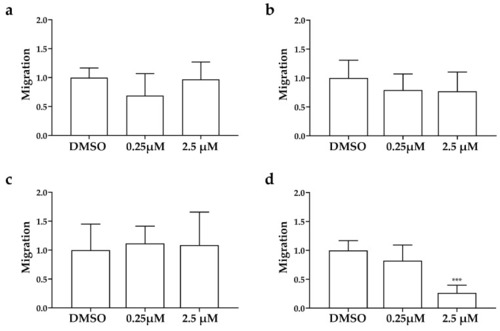
Effects of AXI on invasiveness of human LC cells in grafted zebrafish embryos. Quantification of cell spread in the tail of embryos injected with NCI-H727 (a), UMC-11 (b), NCI-H835 (c) and NCI-H720 (d) cells at 0 and 48 hpi after treatment with AXI (0.25 and 2.5 µM). As arbitrary unit of migration we considered the number of fluorescent particles in the tail. Graphed values represent the mean ± S.E.M. *** p < 0.001.

Effects of AXI incubation on the production of pro-angiogenic growth factors in human LC cell lines. VEGF (a), FGF-1α (b), Angiopoietin-1 (c), Angiopoietin-2 (d) and PDGF-AA (e) were measured via ELISA on cell culture media after 24 h of AXI incubation in LC cell line, as discussed in Materials and Methods. All values were normalized to the cellular proteins of each group. Results were expressed as a percentage compared with the vehicle-treated control (CTR) and represent the mean and S.E.M. of at least three independent experiments. * p < 0.05; ** p < 0.01; *** p < 0.001.

Acknowledgments
This image is the copyrighted work of the attributed author or publisher, and ZFIN has permission only to display this image to its users. Additional permissions should be obtained from the applicable author or publisher of the image. Full text @ Cancers