
Image
|
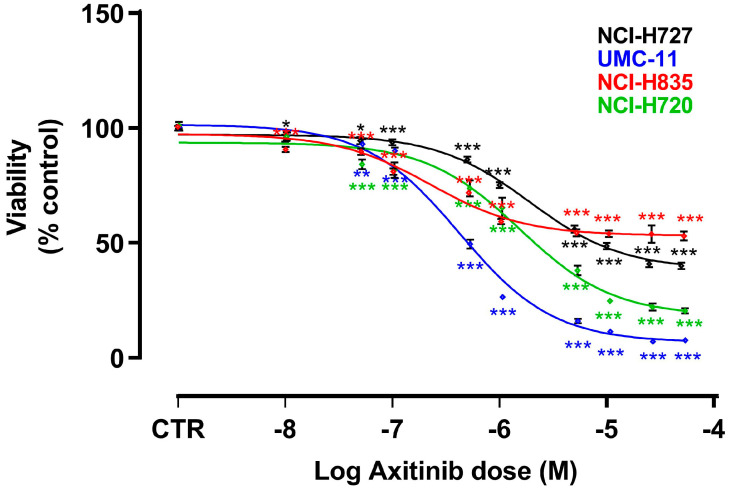
Figure Caption
Figure 1
Effects of AXI on cell viability after 6 days of treatment. Dose response curves were generated after MTT (for NCI-H727 and UMC-11) or MTS (for NCI-H835 and NCI-H720) assays and are expressed as nonlinear regression (curve fit) of log (concentration drug) versus the percentage of vehicle control (CTR). Values represent the mean and S.E.M. of at least three independent experiments. *
Acknowledgments
This image is the copyrighted work of the attributed author or publisher, and
ZFIN has permission only to display this image to its users.
Additional permissions should be obtained from the applicable author or publisher of the image.
Full text @ Cancers