
- Title
-
Feeding frequency does not interact with BPA exposure to influence metabolism or behaviour in zebrafish (Danio rerio)
- Authors
- Rubin, A.M., Seebacher, F.
- Source
- Full text @ Physiol. Behav.
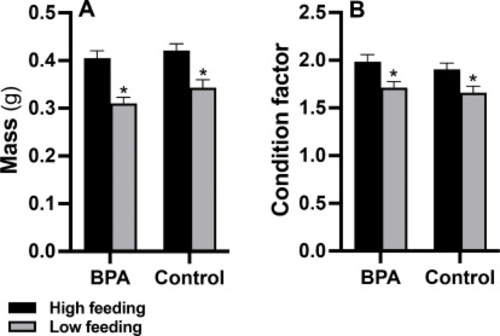
Fish mass and condition factors. Mass (A) and condition factors (B) are shown for BPA exposed and non-exposed (“Control”) fish under high (black bars) and low (grey bars) feeding frequencies. BPA treatment did not have a significant effect but low feeding frequency reduced mass and condition factors (indicated by an asterisk). Data are presented as mean ± s.e. and sample sizes were 15–20 fish per treatment group. |
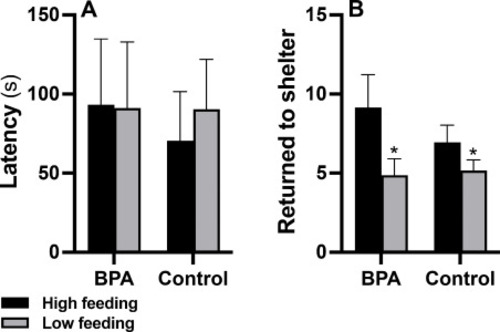
Boldness and refuge seeking behaviour. Latency to leave a shelter (A) the number of times fish returned to the shelter (B) are shown for BPA exposed and non-exposed (“Control”) fish at high (black bars) and low (grey bars) feeding frequencies. BPA treatment did not have a significant effect but low feeding frequency reduced the number of times fish returned to the shelter (indicated by an asterisk). Data are presented as mean ± s.e. and sample sizes were 13–20 fish per treatment group. |
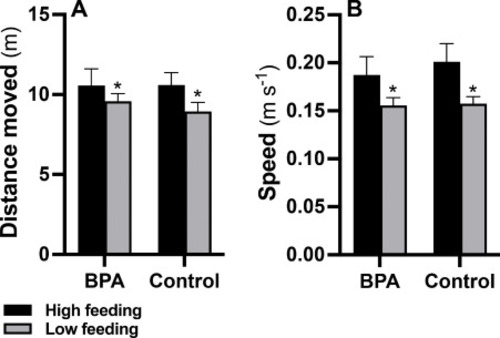
Exploration of a novel arena. Total distance moved (A) and the average speed (B) decreased with low feeding frequency (grey bars) compared to high feeding frequency (black bars; indicated by an asterisk). BPA treatment (BPA Exposed and non-exposed Control) did not have a significant effect. Data are presented as mean ± s.e. and sample sizes were 13–20 fish per treatment group. |
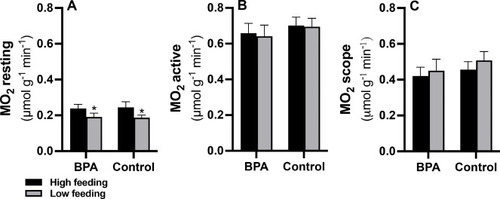
Whole animal oxygen consumption. Resting rates of oxygen consumption (MO2; A) decreased with low feeding frequency (grey bars) compared to high feeding frequency (black bars; indicated by an asterisk), but feeding frequency did not affect active rates of oxygen consumption (B) or aerobic scope (C). BPA treatment (BPA Exposed and non-exposed Control) did not have a significant effect on any measure of oxygen consumption. Data are presented as mean ± s.e. and sample sizes were 15–20 fish per treatment group |
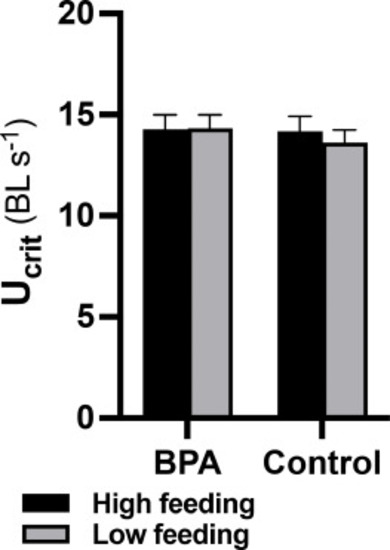
Locomotor performance. Critical sustained swimming speed (Ucrit) was not affected significantly by feeding frequency (high frequency = black bars; low frequency = grey bars), or by BOPA treatment (BPA Exposed and non-exposed Control). Data are presented as means ± s.e. and sample sizes were 15–20 fish per treatment group. |
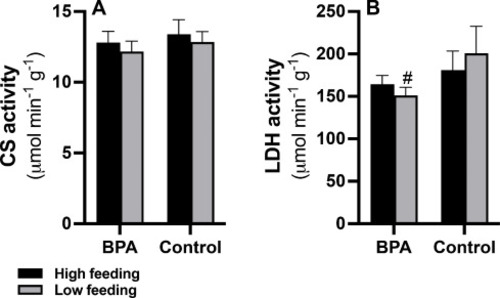
Metabolic enzyme activities. Citrate synthase (CS; A) and lactate dehydrogenase (LDH; B) were not affected significantly by feeding frequency (high frequency = black bars; low frequency = grey bars) but BPA exposure (BPA Exposed and non-exposed Control are shown) decreased LDH activity at one-tailed significance (indicated by #) but did not affect CS activity significantly. Data are presented as mean ± s.e. and sample sizes were 15–20 fish per treatment group. |
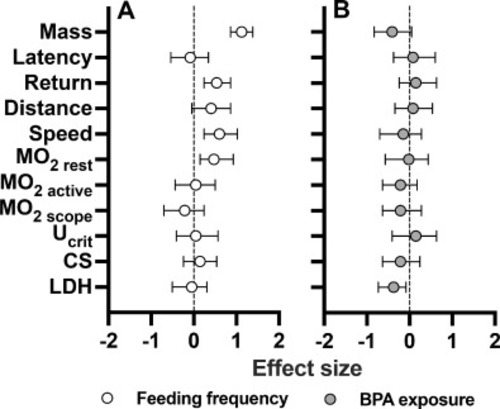
Effect sizes. Effect sizes (standardised mean difference ± bootstrapped 95 % CI) for the main effects of high- relative to low feeding frequency (open circles; A) and BPA exposure relative to control (filled circles; B). Variable names on the y-axis are as in Fig. 1, Fig. 2, Fig. 3, Fig. 4, Fig. 5, Fig. 6. |