
Image
|
Figure Caption
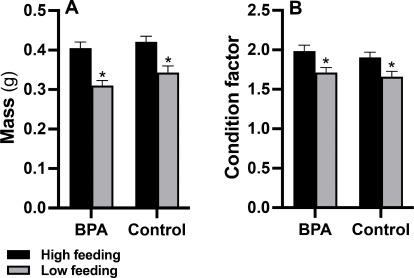
Fig. 1 Fish mass and condition factors. Mass (A) and condition factors (B) are shown for BPA exposed and non-exposed (“Control”) fish under high (black bars) and low (grey bars) feeding frequencies. BPA treatment did not have a significant effect but low feeding frequency reduced mass and condition factors (indicated by an asterisk). Data are presented as mean ± s.e. and sample sizes were 15–20 fish per treatment group.
Acknowledgments
This image is the copyrighted work of the attributed author or publisher, and
ZFIN has permission only to display this image to its users.
Additional permissions should be obtained from the applicable author or publisher of the image.
Full text @ Physiol. Behav.