FIGURE SUMMARY
Title

Endogenous tenocyte activation underlies the regenerative capacity of the adult zebrafish tendon

Authors
Tsai, S.L., VillaseƱor, S., Shah, R.R., Galloway, J.L.
Source
Full text @ NPJ Regen Med

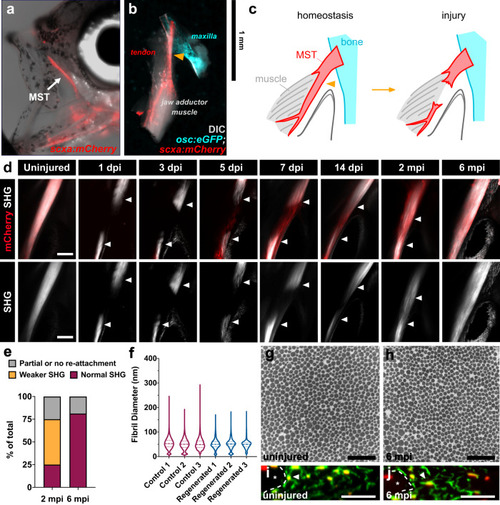
The adult zebrafish can fully regenerate after acute injury.

a Epifluorescence image of an adult scxa:mCherry zebrafish with a brightfield overlay to demonstrate the position of the maxillary superficial tendon (MST) (denoted by white arrow). b Epifluorescence image of a normal uninjured MST musculoskeletal circuit (i.e. maxilla, MST, jaw adductor muscle (A0)) dissected from an osc:eGFP;scxa:mCherry adult zebrafish with a DIC overlay. The Orange arrowhead denotes where the injury is made. c Graphical schematic of the MST before and after injury. d 2-photon images of the MST at various time points after injury in scxa:mCherry zebrafish with SHG signal both overlaid and shown separately. White arrowheads denote the severed tendon ends. Scale bar, 100 µm. e Stacked bar graph showing the breakdown of zebrafish exhibiting partial or no reattachment, weaker SHG signal, or fully restored SHG signal at 2- and 6-months post-injury (mpi) (2 mpi: N = 12; 6 mpi: N = 16). f Violin plot illustrating the collagen fibril diameter distribution in 3 age-matched individuals uninjured and regenerated MSTs at 6 mpi. The means of uninjured controls 1, 2, and 3 were 53.33, 50.24, and 51.35 nm, respectively. Means of injured MSTs 1, 2, and 3 were 50.62, 50.31, and 49.41 nm respectively. Quartile values are shown with a dotted line and the median is shown with a dashed line. g, h Representative 50,000x TEM micrographs from age-matched uninjured (g) and regenerated tendons at 6 mpi (h). Scale bar, 500 nm. i, j Representative images of a cross-sectional re-slice view of 2-photon z-stacks from anti-mCherry stained (shown in green) scxa:mCherry MSTs from age-matched control uninjured (i) and regenerated MSTs at 6 mpi (j). White dotted lines outline muscle boundaries and asterisks mark muscles. Scale bar, 10 µm.

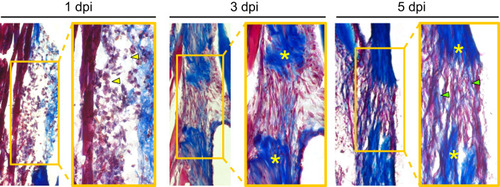
Tendon regeneration proceeds through a rapid series of phases within the first week post-injury.

Masson’s trichrome staining of sections from regenerating tendons at 1 (left), 3 (middle), and 5 (right) dpi. Heavy infiltration of cells with myeloid-like morphologies can be seen at 1 dpi (yellow arrowheads). At 3 dpi, a fibroblastic bridge connecting the two severed tendon ends is evident. By as early as 5 dpi, the beginnings of collagen matrix deposition into the injury site are observed (green arrowheads). Yellow asterisks denote severed tendon ends and images were taken at 10x magnification. Dpi, days post-injury.

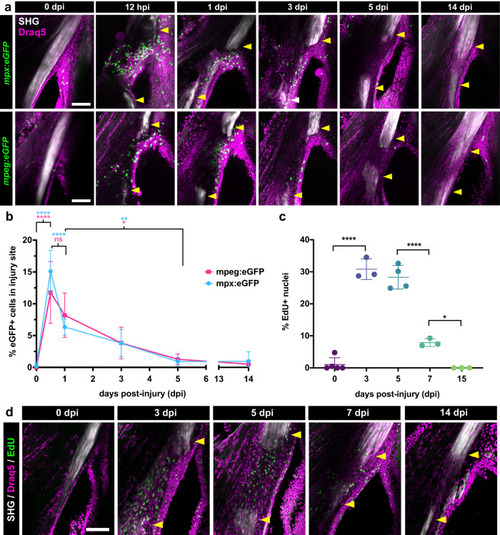
Tendon injury triggers a rapid innate immune response followed by a wave of cellular proliferation.

a 2-photon imaging of regenerating tendons from mpx:eGFP (top row) or mpeg1:eGFP (bottom row) zebrafish at different time points post-injury to examine neutrophil and macrophage dynamics, respectively. SHG signal is overlaid along with a Draq5 nuclear counterstain. Yellow arrowheads denote severed tendon ends. Scale bar, 100 µm. b Quantification of the percentage of mpx:eGFP+ and mpeg1:eGFP+ cells out of total Draq5+ cells in the injury site during the first 2 weeks post-injury. One-way ANOVA analysis was employed for statistical analysis with Tukey’s multiple comparison tests between different time points. Sample sizes were as follows: mpx:eGFP – 0, 1, 14 dpi: N = 4; 0.5, 3, 5 dpi: N = 5; mpeg1:eGFP – 0.5 dpi: N = 6; 0, 1, 3 dpi: N = 5; 5 dpi: N = 4; 14 dpi: N = 3. ****p < 0.0001, **p < 0.01, *p < 0.05. c Quantification of the percentage of EdU+ cells out of total Draq5+ cells in the injured area at 0, 3, 5, 7, and 15 dpi. One-way ANOVA analysis was employed for statistical analysis with Tukey’s multiple comparison tests between time points. Sample sizes were as follows: 0 dpi: N = 5; 3, 7, 15 dpi: N = 3; 5 dpi: N = 4. ****p < 0.0001, *p < 0.05. d Representative 2-photon time course imaging of EdU+ cells (in green) at different time points post-injury. SHG signal is overlaid with Draq5 nuclear staining. Yellow arrowheads denote severed tendon ends. Scale bar, 100 µm. All error bars in graphs denote the standard deviation.

Generation and validation of a scxa:creERT2 transgenic line.

a HCR double in situ hybridization of scxa and cre at 4 days post-fertilization (dpf) shows overlap in expression in craniofacial tendons and ligaments. l, lateral ligament; sh, sternohyoidus tendon; hh, hyohyal tendon. Scale bar, 50 µm. b Schematic of 4OH-T labeling experiment to test tendon labeling in scxa:creERT2; ubi:zebrabow larvae. c, d Representative confocal images from the 4OH-T labeling validation experiment in (b). The labeled SH tendon is shown in c and labeled myoseptal cells in the trunk region are shown in d at 96 h post-fertilization (hpf). Scale bar, 50 µm. e Representative 2-photon image of 4OH-T labeling in the 3-month-old adult MST (outlined in white dotted line). Asterisks denote autofluorescent pigment in the skin. Scale bar, 100 µm. f Confocal image of anti-GFP immunofluorescence to detect CFP+ and/or YFP+ scxa-lineage cells (green) combined with RNAscope in situ hybridization of scxa (magenta). Scale bar, 100 µm. g, h Higher magnification (40x) confocal image of the tendon-bone attachment region of the MST from panel f. scxa-lineage cells overlayed with scxa signal are shown in g, while scxa-lineage cells are shown in h. Scale bar, 50 µm. i, j Higher magnification (40x) confocal image of the midbody region of the MST from panel (f). scxa-lineage cells overlayed with scxa signal are shown in (i), while scxa-lineage cells are shown in (j). Scale bar, 50 µm. k Quantification of the efficiency of scxa:creERT2 labeling in 3 independent adult zebrafish (measuring the percentage of CFP+ and/or YFP+ cells (in green) out of total scxa-expressing cells (in magenta) as detected by RNAscope in situ hybridization). Means of quantified sections from each fish are listed above and error bars in the bar graph denote the standard deviation.

Pre-existing tenocytes are a major cell source of tendon regeneration.

a Experimental schematic of scxa:creERT2; zebrabow lineage tracing experiment during tendon regeneration. b 2-photon imaging showing CFP+ and/or YFP+ scxa-lineage cells infiltrating the injury site at both 4 and 14 days post-injury (dpi). SHG signal is shown either separately or overlaid. White arrowheads denote severed tendon ends. Asterisks denote autofluorescent blood cells. Scale bar, 100 µm. c Quantification of the percentage of CFP+ and/or YFP+ scxa-lineage cells in the regenerating tendon bridge between the severed tendon ends at 14 dpi (N = 5, mean percentage = 55.88% ± 6.93%). The box and whiskers plot shows whiskers extending from the minimum to maximum values, a line at the median, and a box encompassing the 25th to 75th percentiles. d Representative confocal image of an anti-CFP/YFP stained (in green) section of a regenerating tendon at 4 dpi coupled with EdU labeling (in magenta). Higher magnification of regions of the top severed end, injury site, and bottom severed end are shown in e. Asterisks denote the severed tendon ends. Scale bar, 25 µm. e Higher magnification confocal imaging of CFP/YFP stained cells co-labeled with EdU in the top and bottom severed tendon ends as well as the site of injury. White arrowheads denote examples of CFP/YFP+ cells co-labeled with EdU. Scale bar, 25 µm.

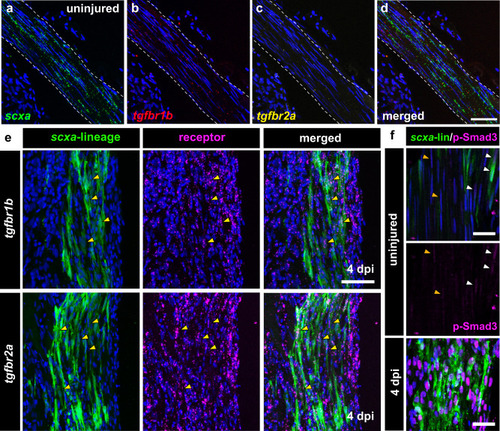
TGF-β signaling is active in tenocytes during regeneration.

ad Multiplexed RNA-scope in situ hybridization of scxa (green, a), tgfbr1b (red, b), and tgfbr2a (yellow, c) in the uninjured tendon. The merged image of all three is shown in (d). Scale bar, 50 µm. e Confocal images of anti-GFP immunofluorescence to detect CFP+ and/or YFP+ scxa-lineage cells (in green) combined with RNAscope in situ hybridization of either tgfbr1b (top panels) or tgfbr2a (bottom panels) in magenta at 4 days post-injury (dpi). Yellow arrowheads denote examples of co-positive cells. Scale bar, 50 µm. f Double immunostaining of anti-GFP immunofluorescence to detect CFP+ and/or YFP+ scxa-lineage cells (in green) with p-Smad3 staining (in magenta) in uninjured and regenerating tendons at 4 dpi. The middle panel shows the p-Smad3 staining alone in the uninjured tendon split from the merged image in the top panel. Orange and yellow arrowheads denote weakly p-Smad3+ nuclei in unlabeled and labeled tenocytes from lineage tracing, respectively. Scale bars, 25 µm.

Canonical TGF-β signaling is required for adult zebrafish tendon regeneration.

a Schematic of experimental design for inhibition of TGF-β signaling during tendon regeneration. b Representative 2-photon stacks of DMSO and SB-431542-treated regenerating tendons at 7 days post-injury (dpi) in scxa:mCherry zebrafish overlaid with second harmonic generation (SHG) signal and Draq5 (in blue) to label nuclei. The 0-7 dpi treatment and 1-7 dpi treatment are shown in the top and bottom panels, respectively. Yellow arrowheads denote the severed tendon ends. Scale bar, 100 µm. c Quantification of the percentage of scxa:mCherry+ cells detected in the injury site at 7 dpi in DMSO and SB-431542-treated zebrafish for both the 0-7 dpi and 1-7 dpi treatments. Unpaired two-tailed t-tests comparing DMSO controls for each treatment with their respective SB-431542-treated counterparts were performed for statistical analysis (0-7 dpi: DMSO, N = 8; SB, N = 6; 1-7 dpi: DMSO, N = 8; SB, N = 7). ****p < 0.0001. d Quantification of the defect size at 7 dpi in DMSO and SB-431542 (SB)-treated zebrafish in both the 0-7 dpi and 1-7 dpi treatments. Unpaired two-tailed t-tests comparing DMSO controls for each treatment with their respective SB-431542-treated counterparts were performed for statistical analysis (0-7 dpi: DMSO, N = 8; SB, N = 7; 1-7 dpi: DMSO, N = 8; SB, N = 7). ****p < 0.0001. Box and whiskers plots in c and d show whiskers extending from the minimum to maximum values, a line at the median, and a box encompassing the 25th to 75th percentiles.

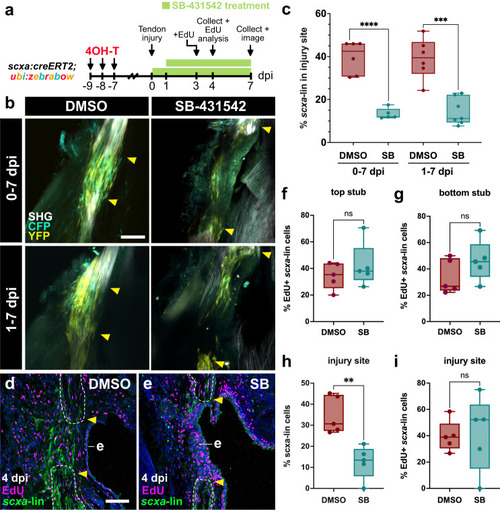
TGF-β signaling is required for tenocyte recruitment, but not proliferation, during bridge formation.

a Experimental schematic of combined tenocyte lineage tracing with SB-431542 treatment and subsequent analyses performed. EdU analysis was only performed on the 1-4 dpi treatment regimen. b 2-photon stacks of CFP+ and/or YFP+ labeled lineage-traced tenocytes in regenerating tendons at 7 days post-injury (dpi) for both 0-7 dpi and 1-7 dpi DMSO/SB-431542 (SB) treatments. Yellow arrowheads denote severed tendon ends. Scale bar, 100 µm. c Quantification of the percentage of scxa-lineage cells in the injury site at 7 dpi for both 0-7 dpi and 1-7 dpi DMSO/SB-431542 (SB) treatments. Unpaired two-tailed t-tests were performed between DMSO controls and their respective SB-431542 counterparts for statistical analysis (0-7 dpi: DMSO, N = 6; SB, N = 5; 1-7 dpi: DMSO, N = 6; SB, N = 7). ****p < 0.0001, ***p < 0.001. d, e Representative confocal images of EdU-stained DMSO and SB-431542 (SB)-treated regenerating tendons at 4 dpi following a 1-4 dpi treatment regimen. EdU staining is shown in magenta and anti-GFP immunofluorescence detection of scxa-lineage cells is shown in green. Severed tendon stubs are outlined in white dotted lines and the tendon ends are denoted by yellow arrowheads. (e), epidermis. fg Quantification of the percentage of proliferating EdU+ scxa-lineage tenocytes in the top (f) and bottom (g) tendon ends at 4 dpi after a 1-4 dpi DMSO or SB-431542 treatment. Unpaired two-tailed t-tests were performed between DMSO and SB-431542 treatment conditions. ns, not significant. h, i Quantification of the percentage of scxa-lineage cells (h) and the percentage of proliferating EdU+ scxa-lineage tenocytes (i) in the injury site at 4 dpi following a 1-4 dpi SB-431542 treatment regimen. Unpaired two-tailed t-tests were performed between DMSO and SB-431542 treatment conditions. **p < 0.01; ns not significant. Box and whiskers plots in panels (c) and (fi) show whiskers extending from the minimum to maximum values, a line at the median, and a box encompassing the 25th to 75th percentiles.

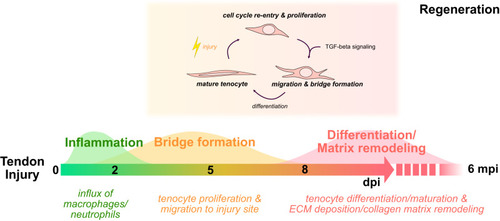
Hallmarks of adult zebrafish tendon regeneration.

Schematic detailing the timeline of key cellular processes following acute tendon injury and regeneration as well as the requirement of TGF-β signaling for tenocyte recruitment. dpi days post-injury, mpi months post-injury.

Acknowledgments
This image is the copyrighted work of the attributed author or publisher, and ZFIN has permission only to display this image to its users. Additional permissions should be obtained from the applicable author or publisher of the image. Full text @ NPJ Regen Med