
- Title
-
Circadian clock1a coordinates neutrophil recruitment via nfe212a/duox-reactive oxygen species pathway in zebrafish
- Authors
- Chen, A.Q., Xue, M., Qiu, C.Z., Zhang, H.Y., Zhou, R., Zhang, L., Yin, Z.J., Ren, D.L.
- Source
- Full text @ Cell Rep.
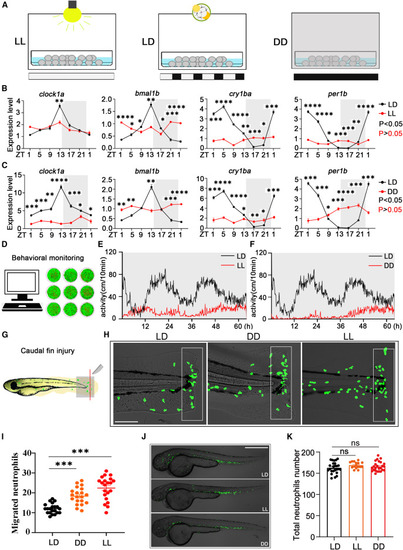
Circadian disorder increases the recruitment of neutrophils to injured tissue (A) Zebrafish embryos were raised in LD, DD, and LL conditions for 4 consecutive days and then tested in LD and DD conditions at 5 dpf. (B and C) The rhythmic expression of clock1a, bmal1b, cry1ba, and per1b was significantly disrupted in larvae raised under LL and DD conditions. Relative expression levels of these genes were normalized to the control gene β-actin. The rhythmic mRNA expression of clock genes was analyzed by the JTK-CYCLE method. Two-way ANOVA was used to analyze the variation between different groups. Each experiment included three samples, and each sample contained 50 larvae. ZT, zeitgeber time; ZT0, light on; ZT14, light off. (D) The movements of zebrafish larvae were constantly monitored by behavioral instruments. (E and F) The locomotor behavior of larvae raised in LL and DD conditions showed irregular rhythms compared with the control group (n = 16, each group). (G) The tail fin of zebrafish was damaged by a surgical blade. (H and I) Neutrophil migration to the injured site at 3 hpw significantly increased in larvae raised in LL and DD conditions at ZT1 (n = 20, each group). The data were analyzed with one-way ANOVA. White boxes represent statistical areas. Scale bar: 10 μm (J and K) There was no significant difference in the total number of fluorescently labeled neutrophil in larvae raised in LD, LL, and DD conditions (n = 20, each group). Scale bar: 50 μm. The data were analyzed with one-way ANOVA. All experiments were repeated three times, and the results show the data from an independent experiment. Bar graphs represent the mean ± standard error of the mean (SEM) (∗p < 0.05; ∗∗p < 0.01; ∗∗∗p < 0.001). |
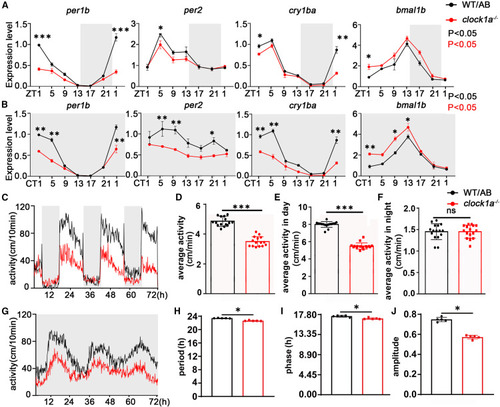
Clock1a plays roles in the zebrafish circadian clock (A and B) Zebrafish embryos were raised in LD conditions for 4 consecutive days and then tested in LD and DD conditions at 5 dpf. Total RNA was extracted from WT and clock1a mutant larvae at 4-h intervals for 24 h under LD and DD conditions. qPCR analysis showed that the amplitudes of key circadian clock genes per1b, per2, and cry1aa were decreased in clock1a mutant fish, but the amplitude of the bma1b gene was increased under both DD and LD conditions. The experiment contained three samples. Each sample contained 50 larvae. The genes were expressed relative to β-actin. The rhythmic mRNA expression was analyzed by the JTK-CYCLE method. Two-way ANOVA was used to analyze the variation between different groups. (C and G) The locomotor activity of clock1a mutant and WT larvae was tested beginning at 5 dpf under LD and DD conditions (n = 24, each group). (D–F) Under LD conditions, the average movement speed of clock1a larvae was significantly decreased during the 24-h period and (E) during the daytime (F) but not at night. Data were analyzed with unpaired t tests. (H–J) Under DD conditions, (H) the movement period and (J) amplitude were decreased and (I) the phase was advanced in clock1a larvae. Data were analyzed with unpaired t tests. All experiments were repeated three times, and the results show the data from an independent experiment. Bar graphs represent the mean ± SEM (∗p < 0.05; ∗∗p < 0.01; ∗∗∗p < 0.001). |
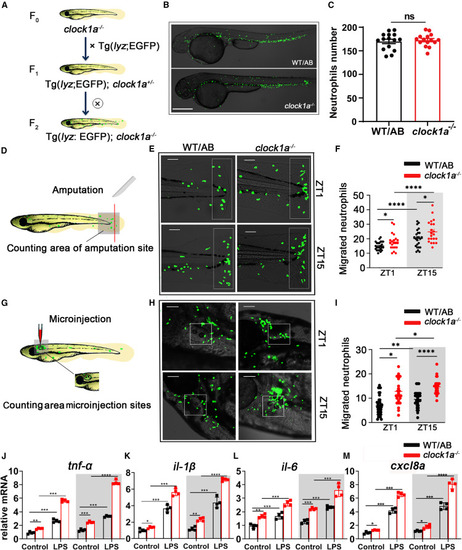
Clock1a regulates the rhythmic migration of neutrophils to inflamed tissue (A) Hybridization of the transgenic line Tg(lyz:EGFP) and clock1a mutant was performed for two consecutive generations to obtain the Tg(lyz:EGFP);clock1a−/− line. (B and C) The total number of fluorescently labeled neutrophils in WT and clock1a−/− larvae showed no significant difference (n = 15, each group). Scale bar: 50 μm. Data were analyzed with unpaired t tests. (D) Schematic of larval (5 dpf) tail fin injury with a surgical blade at the end of the spinal cord at ZT1 and ZT15. (E and F) In WT zebrafish, neutrophil migration toward the injury was rhythmic, and Tg(lyz:EGFP);clock1a−/− larvae showed increased neutrophil migration at both ZT1 and ZT15 (n = 25, each group). Scale bar: 5 μm. Data were analyzed with one-way ANOVA. (G) Schematic of LPS microinjection into otic vesicles in vivo at ZT1 and ZT15. (H and I) In WT zebrafish, neutrophil migration toward LPS was rhythmic, and Tg(lyz:EGFP);clock1a−/− larvae showed increased neutrophil migration at both ZT1 and ZT15 (n = 25, each group). Scale bar: 5 μm. Data were analyzed with one-way ANOVA. Scale bar: 4 μm. (J–M) Under homeostasis, the mRNA expression of the cytokines tnf-α, il-1β, il-6, and cxcl8a showed circadian rhythms, and clock1a mutation significantly upregulated their expression. Under LPS stimulation, the expression of the cytokines tnf-α, il-1β, il-6, and cxcl8a showed circadian rhythms, and clock1a mutation significantly upregulated their expression. Data were analyzed with one-way ANOVA. All experiments were repeated three times, and the results show the data from an independent experiment. Bar graphs represent the mean ± SEM (∗p < 0.05; ∗∗p < 0.01; ∗∗∗p < 0.001). |
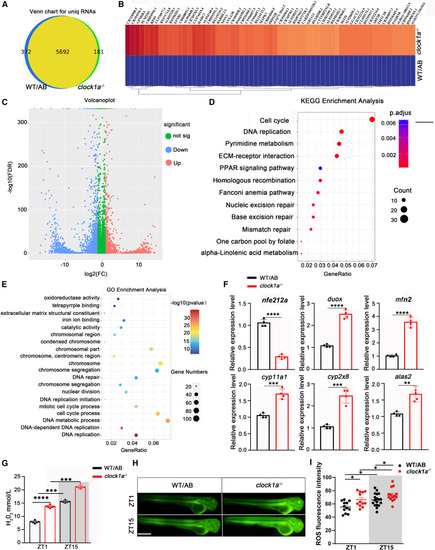
Clock1a modulates genes associated with reactive oxygen generation Transcriptome sequencing was performed to determine the downstream genes of clock1a that regulate neutrophil recruitment. Total RNA was extracted from clock1a−/− and WT/AB zebrafish raised under normal LD conditions at 4 dpf. (A) The Venn diagram shows the number of unique RNAs in clock1a mutant zebrafish. (B and C) The heatmap and volcano plot show downregulated and upregulated genes in clock1a mutant zebrafish. (D and E) KEGG and GO enrichment analyses of DEGs classified the genes into different processes. (F) The expression levels of nfe212a, duox, mfn2, crp11a1, cyp2x8, and alas2 were confirmed with independent qPCR experiments. Data were analyzed with unpaired t tests. (G) The hydrogen peroxide content of the clock1a mutant increased significantly at both ZT1 and ZT15 (n = 20). Data were analyzed with one-way ANOVA. (H and I) Fluorescence staining revealed that clock1a mutation upregulated reactive oxygen production (n = 12). Scale bar: 50 μm. Data were analyzed with one-way ANOVA. All experiments were repeated three times, and the results showed the data from an independent experiment. Bar graphs represent the mean ± SEM (∗p < 0.05; ∗∗p < 0.01; ∗∗∗p < 0.001). |

Zebrafish nfe212a and duox genes are rhythmically regulated by Clock1a Zebrafish embryos were raised in LD conditions for 4 consecutive days and then tested in LD and DD conditions at 5 dpf. (A and B) nfe212a was expressed rhythmically in zebrafish larvae under LD and DD conditions. The rhythmic mRNA expression was analyzed by the JTK-CYCLE method. (C–E) Upregulated expression of nfe212a in per1b−/−, per2−/−, and clock1a−/− mutant zebrafish under DD conditions. Each experiment included three samples, and each sample contained 50 larvae. The genes were expressed relative to β-actin. The rhythmic mRNA expression was analyzed by the JTK-CYCLE method. (F) The clock1a-Myc sequence was cloned and inserted into the expression vector with the T7 promoter. (G and H) ChIP-qPCR assays showed that exogenous Clock1a bound to the E-box element in the nfe212a promoter. Data were analyzed with one-way ANOVA. (I) ChIP-qPCR assays showed that endogenous Clock bound to the E-box element in the nfe212a promoter at ZT1 and ZT15. Data were analyzed with one-way ANOVA. (J) The nfe212a-E-luc and CMV-dsRed plasmids were co-transfected into 293T cells. Scale bar: 30 μm. (K) Luciferase reporter assays showed that nfe212a-E-luc was activated by Clock1a and Bmal1b but inhibited by Cry1aa. Data were analyzed with one-way ANOVA. (L and M) Duox was rhythmically expressed in zebrafish larvae under LD and DD conditions. The rhythmic mRNA expression was analyzed by the JTK-CYCLE method. (N–P) The rhythmic expression of nfe212a in per1b−/− and per2−/− mutant zebrafish under DD conditions was significantly disrupted. The clock1a mutant upregulated duox expression, and nfe212a mRNA rescued this phenomenon. The rhythmic mRNA expression was analyzed by the JTK-CYCLE method. All experiments were repeated three times, and the results show the data from an independent experiment. Bar graphs represent the mean ± SEM (∗p < 0.05; ∗∗p < 0.01; ∗∗∗p < 0.001). |
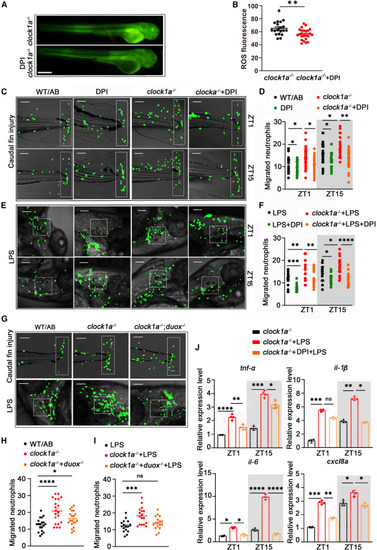
ROSs participate in the rhythmic regulation of neutrophil recruitment by Clock1a (A and B) Fluorescence staining showed that DPI treatment significantly inhibited ROS production (n = 20). Scale bar: 50 μm. Data were analyzed with unpaired t tests. (C and D) In the fin damage model, DPI treatment significantly suppressed the increased neutrophil recruitment due to clock1a mutation at both ZT1 and ZT15 (n = 20). Scale bar: 10 μm. Data were analyzed with one-way ANOVA. (E and F) In the LPS injection model, DPI treatment also significantly suppressed the increased neutrophil migration caused by clock1a mutation at both ZT1 and ZT15 (n = 20). Scale bar: 5 μm. Data were analyzed with one-way ANOVA. (G) The clock1a−/−;duox−/− mutant was obtained by crossing the clock1a and duox mutants. Scale bar: 10 μm. (H and I) The duox mutation was found to reverse the increased neutrophil migration caused by the clock1a mutation to some extent in both (H) caudal fin injury and (I) LPS challenge models at both ZT1 and ZT15 (n = 20). Scale bar: 6 μm. Data were analyzed with one-way ANOVA. (J) DPI treatment significantly downregulated the clock1a-mutation-induced increase in cytokine expression at both ZT1 and ZT15. Data were analyzed with one-way ANOVA. All experiments were repeated three times, and the results show the data from an independent experiment. Bar graphs represent the mean ± SEM (∗p < 0.05; ∗∗p < 0.01; ∗∗∗p < 0.001). |