- Title
-
Fluoxetine rescues the depressive-like behaviour induced by reserpine and the altered emotional behaviour induced by nicotine withdrawal in zebrafish: Involvement of tyrosine hydroxylase
- Authors
- Braida, D., Ponzoni, L., Dellarole, I., Morara, S., Sala, M.
- Source
- Full text @ J. Psychopharmacol. (Oxford)
|
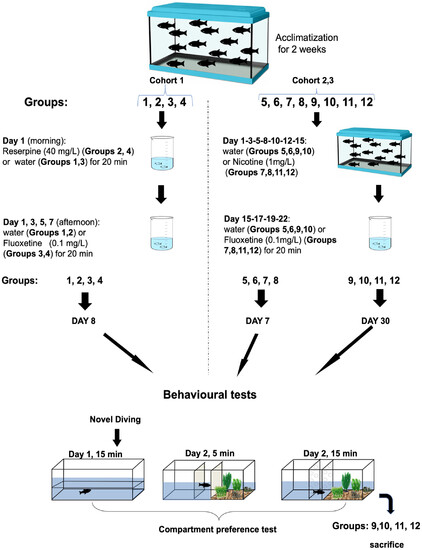
A summary of the study’s experimental design. As shown in the timeline, after acclimatization, behavioural testing involved the Compartment Preference and Novel Tank Diving tests evaluated after 20 minutes of exposure to reserpine and fluoxetine (for 20 minutes) 7 days after reserpine every other day (Group A), 7 (Group B), or 30 (Group C) days after nicotine (1 mg/ml) withdrawal exposure. |
|
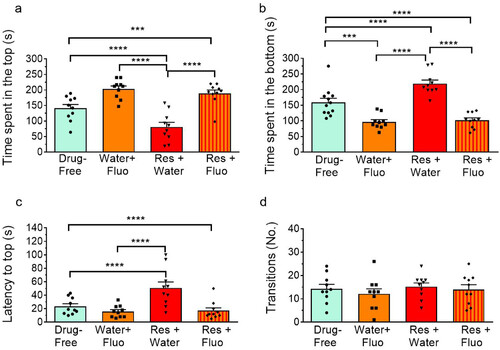
Effect of reserpine (40 µg/ml for 20 minutes) and fluoxetine (Fluo) (0.1 mg/L) given alone 7 days after reserpine and their association on Novel Tank Diving test. Over the 5-minute session, the time spent on top dwelling and bottom (a, b), the latency to top (c) and the number of transitions to upper half (d) were recorded. Zebrafish were exposed to reserpine and tested 7 days after. Zebrafish were exposed to Fluo dissolved in the beaker for 20 minutes on alternate days. Data are shown as mean ± SEM of 10 fish for each group (one-way analysis of variance (ANOVA) followed by post hoc Tukey’s test). |
|
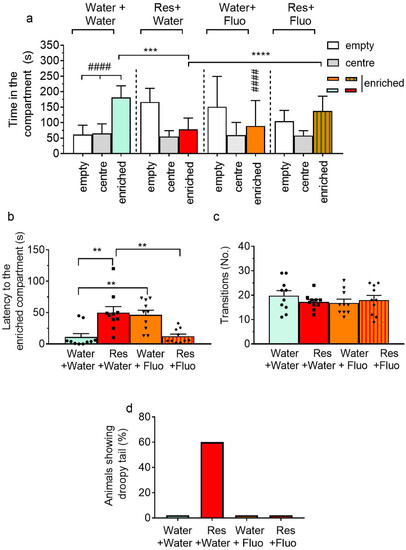
Effect of reserpine and fluoxetine (Fluo) in the Compartment Preference test. Behaviour was evaluated for 5 minutes in terms of (a) time spent in three different compartments (empty, centre and enriched), (b) latency to the enriched side, (c) a total number of transitions to the enriched side, and (d) animals showing droopy tail. Zebrafish were exposed to reserpine (40 µg/ml) or water and, on the following 7 days, on alternate days, to Fluo (0.1 mg/l) or vehicle for 20 minutes in a beaker. Data are mean ± SEM. N = 10 animals for each group (one- or two-way analysis of variance (ANOVA) followed by post hoc Tukey’s or Bonferroni’s test). |
|
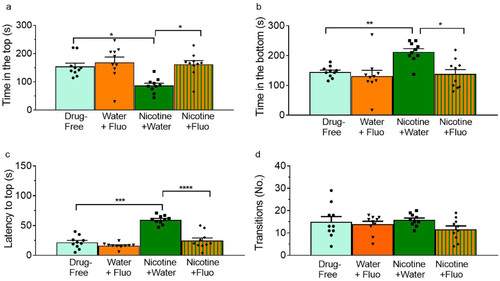
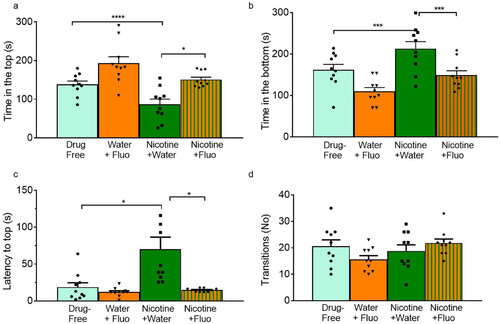
Effect of exposure to nicotine for 14 days, to fluoxetine (Fluo) (0.1 mg/L) and to their association on Novel Tank Diving test evaluated 7 days after nicotine cessation. Zebrafish were exposed to Fluo for 20 minutes in the beaker. Over the 5-minute session, the time spent on top dwelling and bottom (a, b), the latency to the top (c) and the number of transitions to the upper half (d) were recorded. Data are shown as mean ± SEM of 10 fish for each group (one-way analysis of variance (ANOVA) followed by Tukey’s test). |
|
Effect of exposure to nicotine for 14 days, to fluoxetine (Fluo) (0.1 mg/l) and to their association on Novel Tank Diving test evaluated 30 days after nicotine cessation. Zebrafish were exposed to Fluo for 20 minutes in the beaker for 1 week after nicotine cessation. Over the 5-minute session, the time spent on top dwelling and bottom (a, b), the latency to the top (c) and the number of transitions to the upper half (d) were recorded. Data are shown as mean ± SEM of 10 fish for each group (one-way analysis of variance (ANOVA) followed by Tukey’s test). |
|
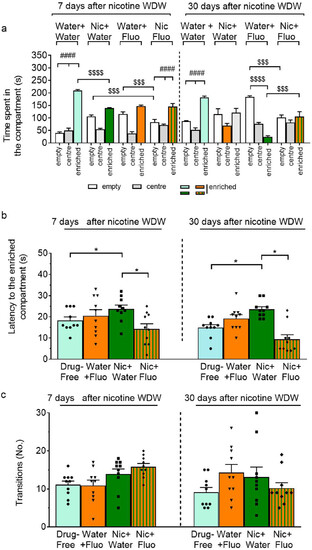
Effect of fluoxetine (Fluo) (0.1 mg/l) exposure on nicotine (1 mg/l), pre-exposure (for 2 weeks) and Fluo (0.1 mg/l) in the Compartment Preference test. Zebrafish were exposed to Fluo or water for 20 minutes in the beaker for 7 days on alternate days, after nicotine cessation. Behaviour was evaluated for 5 minutes on Day 7 and Day 30, from nicotine cessation, in terms of (a) time spent in three different compartments (empty, centre and enriched), (b) latency to the enriched side and (c) a total number of transitions to the enriched side. Data are mean ± SEM of the mean of 10 animals per group (one- or two-way analysis of variance (ANOVA) followed by post hoc Bonferroni test). |
|
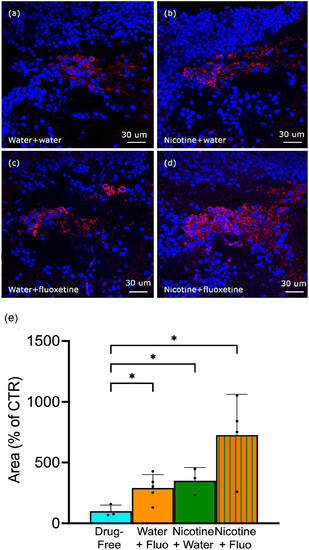
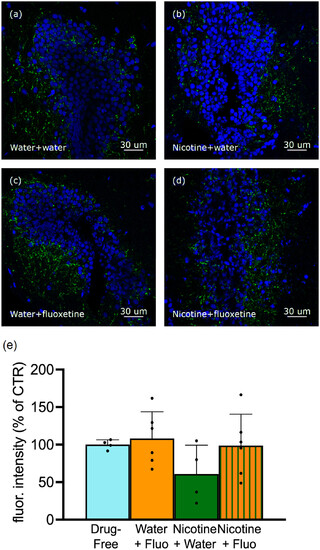
Tyrosine hydroxylase (TH) expression was evaluated in the parvocellular pretectal nucleus (PPN) 30 days after spontaneous nicotine withdrawal in zebrafish. Top: representative images obtained from coronal sections through the PPN show TH immunofluorescence in (a) control (drug-free water + water), (b) nicotine + water, (c) water + fluoxetine and (d) nicotine + fluoxetine. (e) quantitative analysis is expressed as a percentage of the mean area control value. Data are mean ± SEM of the mean of 3/5 zebrafish/group. Each dot represents one animal. *p < 0.05 (one-way analysis of variance (ANOVA) followed by post hoc t test). |
|
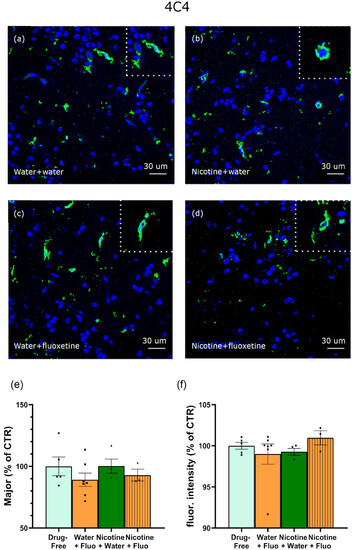
4C4 expression was evaluated in the PPN 30 days after spontaneous nicotine withdrawal. Representative images obtained from coronal sections show 4C4 immunofluorescence in (a) control (drug-free water + water), (b) nicotine + water, (c) water + fluoxetine and (d) nicotine + fluoxetine. Insets show representative examples of microglial cells. (e, f) Quantitative analysis. No change in 4C4 immunofluorescence area (e) nor in morphological parameters (f) are shown (here major is shown: the major axis of the best fitting ellipse of the analysed cell) (e) nor in 4C4 fluorescence intensity (f). Data are mean ± SEM of the mean of 3/7 zebrafish/group (25–88 cell/group) (one-way analysis of variance (ANOVA)). Each dot represents one animal. (one-way ANOVA). |
|
Calcitonin gene-related peptide (CGRP) expression was evaluated in the dorsal zone of the periventricular hypothalamus (posterior half of the posterior aspect of the lateral recess) of zebrafish 30 days after spontaneous nicotine withdrawal. Top: representative images obtained from confocal scans of CGRP immunofluorescence in (a) control (drug-free water + water), (b) nicotine + water, (c) water + fluoxetine, (d) nicotine + fluoxetine and (e) the intensity of the CGRP signal is expressed as a median. The quantitative analysis is expressed as the percentage of mean fluorescence intensity control value. Data are mean ± SEM of the mean of 4/6 zebrafish/group. Each dot represents an animal. Each dot represents an animal. |

