
- Title
-
Ethanol and caffeine age-dependently alter brain and retinal neurochemical levels without affecting morphology of juvenile and adult zebrafish (Danio rerio)
- Authors
- Clayman, C.L., Hwang, C., Connaughton, V.P.
- Source
- Full text @ PLoS One
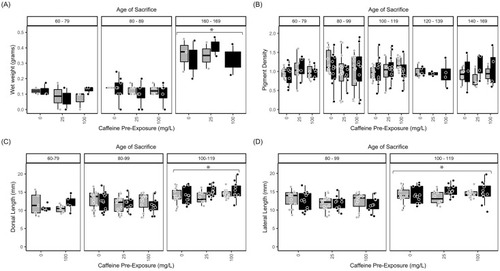
Acute 7-day exposure to caffeine and/or ethanol does not alter length or weight. (A) Wet weight (g), (B) pigment density, (C) dorsal length (mm), and (D) lateral length (mm) measurements of zebrafish co-exposed to caffeine and ethanol. Measurements were taken immediately after the 7-d exposure period. Measurements were pooled to assess the effect of age of sacrifice across these experimental conditions. Exposure ages (dpf) are indicated at the top of the bar graphs. Black bars = 1.5% ethanol; gray bars = control (0% ethanol). Caffeine exposures (0, 25, or 100 mg/L) are given along the x-axis. Data from individual fish were assessed in age bins to facilitate comparisons: 60–79 dpf (juveniles); 80–99 dpf (young adult); 100–119; 120–139; 140–169 dpf (adult). Wet weight was collected from 60–79 dpf, 80–89 dpf, and 160–169 dpf fish only, to identify the largest differences. Neither caffeine nor ethanol exposure affected measurements. However, age-dependent differences were noted (asterisks). The boxplots show the minimum, first quartile, median, third quartile, and maximum values for each measure after outliers were removed. For weight (A), there were 3 independent replicates per treatment condition (each ethanol/caffeine dose) for a total of 18 subjects. For all other parameters (B, C, D) there were 7–9 independent replicates per treatment condition for a total of 51 subjects. ANOVA tables and multiple comparison results for this data can be found in |

Age, but not ethanol and/or caffeine treatment, significantly affects eye diameter. As in |

Zebrafish Brain TH levels increase with age and ethanol withdrawal. Normalized TH levels in brain homogenates from zebrafish treated with 1.5% ethanol (black bars) or water (control, gray bars) plotted across caffeine dose (0 mg/L; 25 mg/L, 100 mg/L). (A) TH levels in brain tissue assessed immediately after exposure. Fish exposed at 140–149 dpf had increased TH levels relative to other exposure ages (p<0.0.006; asterisk). (B) TH levels were also compared across time of sacrifice—immediately after exposure, after the short post-exposure interval, or after the long post-exposure interval. Tissue collected immediately had significantly greater TH levels compared to tissue collected after the short interval or long interval (p<0.0037; asterisk). The boxplots show the minimum, first quartile, median, third quartile, and maximum values for each measure after outliers were removed. Exposure ages (dpf) are indicated at the top of the bar graphs. For brain TH levels, there were 4–6 independent replicates per treatment condition (each ethanol/caffeine dose) for a total of 35 subjects. ANOVA tables and multiple comparison results for this data can be found in |

Zebrafish Retina TH levels are affected by age and ethanol withdrawal. Normalized retinal TH levels from zebrafish exposed to 1.5% ethanol (black bars) or water (control, grey bars) with or without caffeine (0 mg/L; 25 mg/L, 100 mg/L). (A) TH levels assessed immediately after exposure. Fish exposed at 50–59 dpf and 70–99 dpf had significantly higher retinal TH levels relative to 140–149 dpf (p<0.008; asterisk). (B) TH levels of retinal homogenates revealed significantly greater TH levels after the immediate post-exposure interval, compared to fish sacrificed after the short or long post-exposure interval (p<0.004; asterisk). The boxplots show the minimum, first quartile, median, third quartile, and maximum values for each measure after outliers were removed. Exposure ages (dpf) are indicated at the top of the bar graphs. For retina TH levels, there were 4–6 independent replicates per treatment condition (each ethanol/caffeine dose) for a total of 35 subjects. ANOVA tables and multiple comparison results for this data can be found in |

Zebrafish Brain GAD65/67 levels vary with age. Normalized brain GAD65/67 levels of zebrafish exposed to 1.5% ethanol (black bars) or water (gray bars) ± caffeine (0 mg/L; 25 mg/L, 100 mg/L). (A) There was a significant effect of pre-exposure age on brain GAD levels. GAD65/67 levels in brain tissue collected immediately after exposure showed a trend of increased levels when fish were exposed earlier, from 50–59 dpf, compared to later ages (60–149 dpf). (B) GAD65/67 levels assessed across the post-exposure time points showed a trend of greater GAD65/67 levels in subjects exposed after a long interval compared to those sacrificed immediately. The boxplots show the minimum, first quartile, median, third quartile, and maximum values for each measure after outliers were removed. Exposure ages (dpf) are indicated across the top of the bar graphs. For brain GAD levels, there were 4–6 independent replicates per treatment condition (each ethanol/caffeine dose) for a total of 35 subjects. ANOVA tables and multiple comparison results for this data can be found in |

Zebrafish Retinal GAD65/67 levels were affected by caffeine. Normalized retinal GAD65/67 levels from zebrafish exposed to 1.5% ethanol (black bars) or water/control (gray bars) ± caffeine (0 mg/L; 25 mg/L, 100 mg/L). (A) GAD65/67 levels in retinal tissue measured immediately after pre-exposure were increased in fish exposed from 140–149 dpf compared to 50–69 dpf (p<0.03). Retinal GAD 65/67 levels were also increased in fish exposed from 70–99 dpf compared to 50–69 dpf (p<0.02; asterisk). (B) Retinal GAD65/67 levels assessed across the post-exposure time points did not identify any differences across groups. The boxplots show the minimum, first quartile, median, third quartile, and maximum values for each measure after outliers were removed. Exposure ages (dpf) are indicated across the top of the bar graphs. For retina GAD levels, there were 4–6 independent replicates per treatment condition (each ethanol/caffeine dose) for a total of 35 subjects. ANOVA tables and multiple comparison results for this data can be found in |