
- Title
-
Effects of carnosine on the embryonic development and TiO2 nanoparticles-induced oxidative stress on Zebrafish
- Authors
- Caruso, G., Scalisi, E.M., Pecoraro, R., Cardaci, V., Privitera, A., Truglio, E., Capparucci, F., Jarosova, R., Salvaggio, A., Caraci, F., Brundo, M.V.
- Source
- Full text @ Front Vet Sci
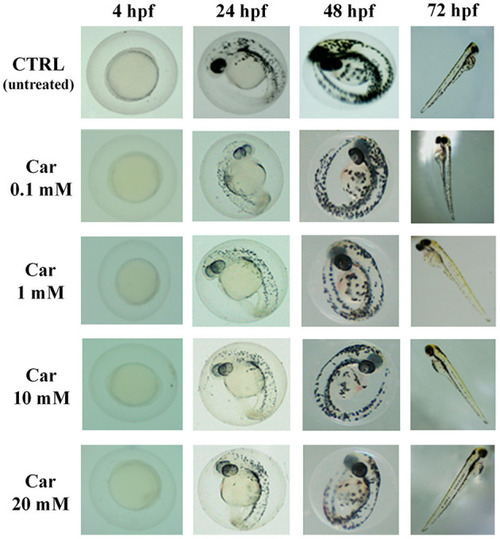
Effects of increasing concentrations of carnosine (0.1, 1, 10, and 20 mM) on the phenotypes of both embryos and larvae at different (4, 24, 48, and 72) hpf. Car, carnosine. |
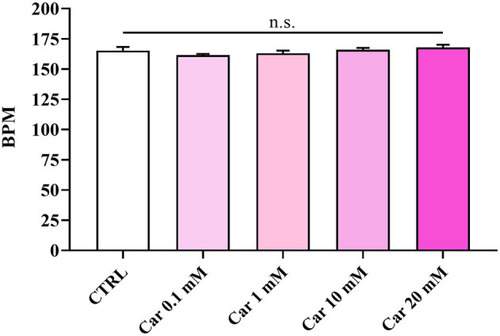
Beats per minute (BPM) of unexposed larvae and larvae exposed to increasing concentrations of carnosine (0.1, 1, 10, and 20 mM). SD is represented by vertical bars. Car, carnosine; n.s., not significant. |
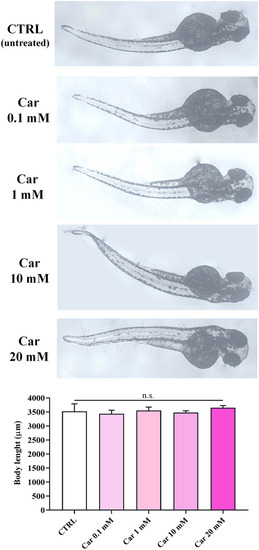
Body length (μm) of unexposed larvae and larvae exposed to increasing concentrations of carnosine (0.1, 1, 10, and 20 mM). SD is represented by vertical bars. Car, carnosine; n.s., not significant. |

Effects of TiO2-NPs on the phenotypes of both embryos and larvae at different (4, 24, 48, and 72) hpf. |
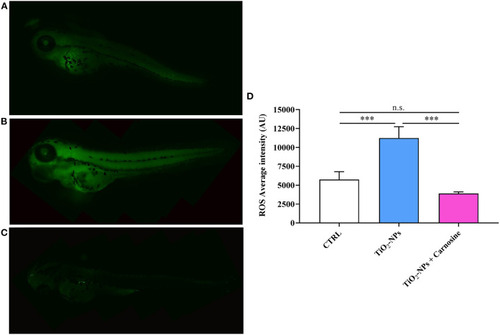
Total ROS production in (A) untreated larvae, (B) TiO2-NPs-treated larvae, and (C) TiO2-NPs-treated larvae in the presence of carnosine 20 mM (1 h pre-treatment). Carnosine was kept during the exposure to TiO2-NPs. The average fluorescence intensity (AU) of at least 5 values for fixed larva is reported in (D). SD is represented by vertical bars. ***Significantly different, p < 0.001. n.s., not significant. |
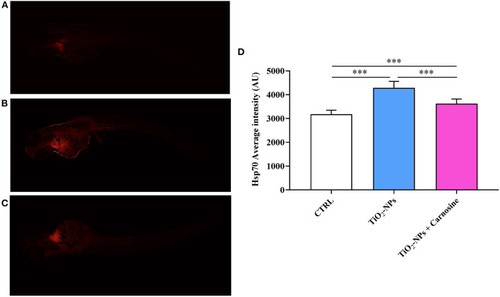
Hsp70 expression levels in (A) untreated larvae, (B) TiO2-NPs-treated larvae, and (C) TiO2-NPs-treated larvae in the presence of carnosine 20 mM (1 h pre-treatment). Carnosine was kept during the exposure to TiO2-NPs. The average fluorescence intensity (AU) of at least 5 values for fixed larva is reported in (D). SD is represented by vertical bars. ***Significantly different, p < 0.001. |
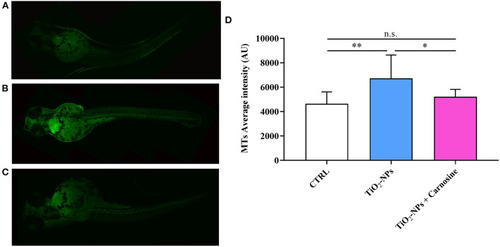
MTs expression levels in (A) untreated larvae, (B) TiO2-NPs-treated larvae, and (C) TiO2-NPs-treated larvae in the presence of carnosine 20 mM (1 h pre-treatment). Carnosine was kept during the exposure to TiO2-NPs. The average fluorescence intensity (AU) of at least 4 values for fixed larva is reported in (D). SD is represented by vertical bars. *Significantly different, p < 0.05; **Significantly different, p < 0.01; n.s., not significant. |