
Image
|
Figure Caption
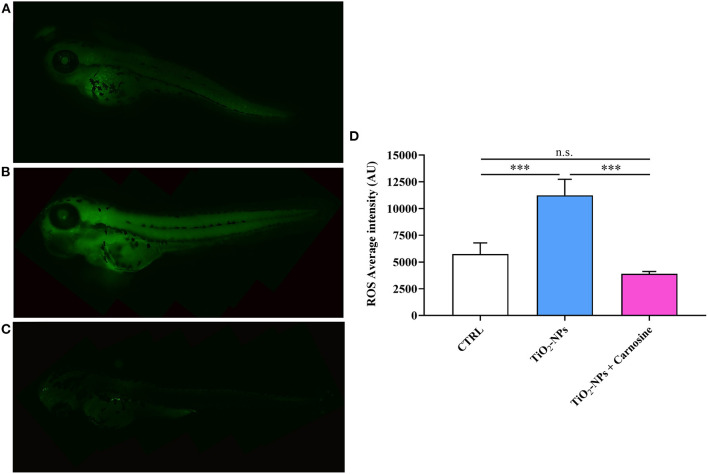
Figure 5
Total ROS production in (A) untreated larvae, (B) TiO2-NPs-treated larvae, and (C) TiO2-NPs-treated larvae in the presence of carnosine 20 mM (1 h pre-treatment). Carnosine was kept during the exposure to TiO2-NPs. The average fluorescence intensity (AU) of at least 5 values for fixed larva is reported in (D). SD is represented by vertical bars. ***Significantly different, p < 0.001. n.s., not significant.
Acknowledgments
This image is the copyrighted work of the attributed author or publisher, and
ZFIN has permission only to display this image to its users.
Additional permissions should be obtained from the applicable author or publisher of the image.
Full text @ Front Vet Sci