
- Title
-
Genetic mapping and molecular mechanism behind color variation in the Asian vine snake
- Authors
- Tang, C.Y., Zhang, X., Xu, X., Sun, S., Peng, C., Song, M.H., Yan, C., Sun, H., Liu, M., Xie, L., Luo, S.J., Li, J.T.
- Source
- Full text @ Genome Biol.
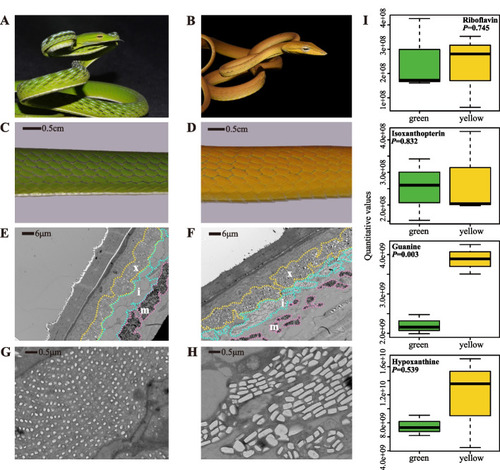
Skin color and cellular differences in two morphs of Ahaetulla prasina. A, B Green and yellow Ahaetulla prasina snakes showing same morphology except for skin color. C, D Color details in dorsal skin of two morphs showing distinct differences in hue. E, F TEM images of three chromatophore layers with orderly arrangement in dorsal skin, but with differences in iridophore and melanophore cellular morphology. G, H Images of different iridophore structures between two morphs. I Contents of colored metabolites in skin of both morphs obtained by HPLC-MS/MS. x, xanthophores; i, iridophores; m, melanophores |
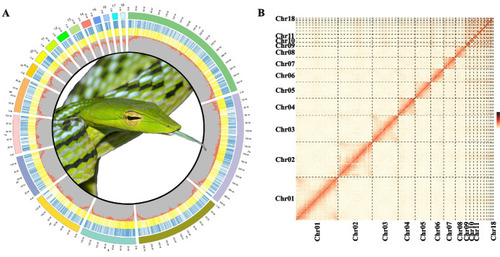
Genomic landscape of Ahaetulla prasina. A Circos diagram of Ahaetulla prasina genome characteristics. Numbers 1 to 18 refer to chromosomes sequenced, with circular rings outside to inside referring to coding genes of plus (blue) and minus (yellow) strand, and GC content per 100-kb window, respectively. B Hi-C interactions among 18 chromosomes of Ahaetulla prasina. Darker color indicates stronger interactions |
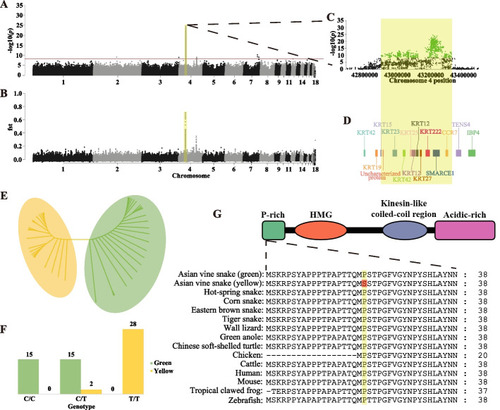
Whole-genome sequencing identification of amino acid substitution P20S in SMARCE1 on chromosome 4, associated with skin color differences. A, B Manhattan plot showing a single region on Chr04, significantly associated with color differences between morphs. Red dash indicates Bonferroni-corrected critical p-value (−log10(p) = 8.4). C Association signals of GWAS analysis and genetic differentiation (Fst) in significant signal region. D Gene models within significant signal region. E Maximum-likelihood tree constructed by SNPs within significant signal region. F Correlations between Ahaetulla prasina skin color phenotypes and genotypes of SMARCE1 p.P20S. G Schematic and partial alignment of SMARCE1 showing location of P20S in an evolutionarily conserved region within a proline-rich structure across vertebrates |
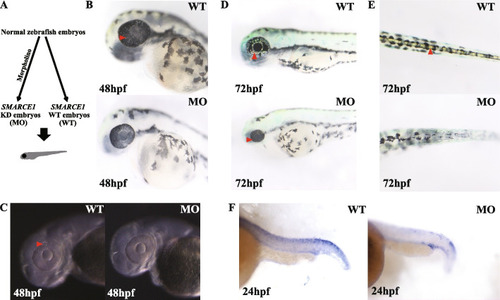
Morpholino-injected embryos show abnormal development of iridophores. A Schematic of SMARCE1 knockdown in zebrafish embryos using morpholinos. B Visible iridophores were observed in the eyes of wild-type (WT) embryos but not in morphants (MO) at 48 hpf. C Under high-contrast display mode, light-reflecting iridophores were found in WT embryos at 48 hpf. D At 72 hpf, morphants contained primary differentiated iridophores, as shown in WT embryos at 48 hpf, while a large number of iridophores were seen in WT eyes. E Obvious mature iridophores were observed in dorsal of WT versus morphant embryos at 72 hpf. F ISH analysis showed reduced tfec expression in tails of morphants at 24 hpf. Arrows indicate visible iridophores. All images were taken under reflected light EXPRESSION / LABELING:
PHENOTYPE:
|
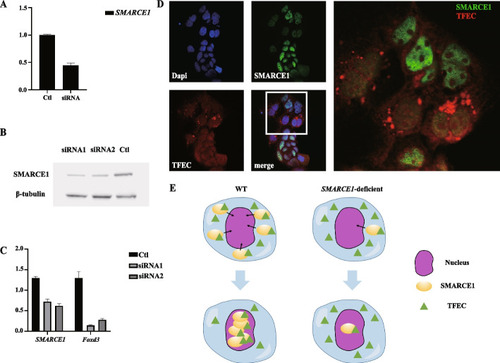
SMARCE1 deficiency in Caco2 cells blocks recruitment of tfec in nucleus. A SMARCE1 expression in purified Caco2 cell population determined by qRT-PCR. Ctl, control group; siRNA, siRNA-injected group. B Immunoblotting analysis of SMARCE1 in Caco2 cells. Ctl, control group; siRNA1 and siRNA2, siRNA-injected groups. C SMARCE1 and Foxd3 expression in purified Caco2 cell population determined by qRT-PCR. Ctl, control group; siRNA1 and siRNA2, siRNA-injected groups. D Immunofluorescence staining of SMARCE1 and tfec showing substantial accumulation of tfec fluorescence signals around the nucleus in SMARCE1-deficient Caco2 cells. E Schematic of possible mechanism by which defective SMARCE1 impedes tfec nuclear recruitment |

ZFIN is incorporating published figure images and captions as part of an ongoing project. Figures from some publications have not yet been curated, or are not available for display because of copyright restrictions. PHENOTYPE:
|