
Fig. 3
- ID
- ZDB-IMAGE-230313-11
- Publication
- Tang et al., 2023 - Genetic mapping and molecular mechanism behind color variation in the Asian vine snake
- All Figures
- Figures for Tang et al., 2023
|
Fig. 3
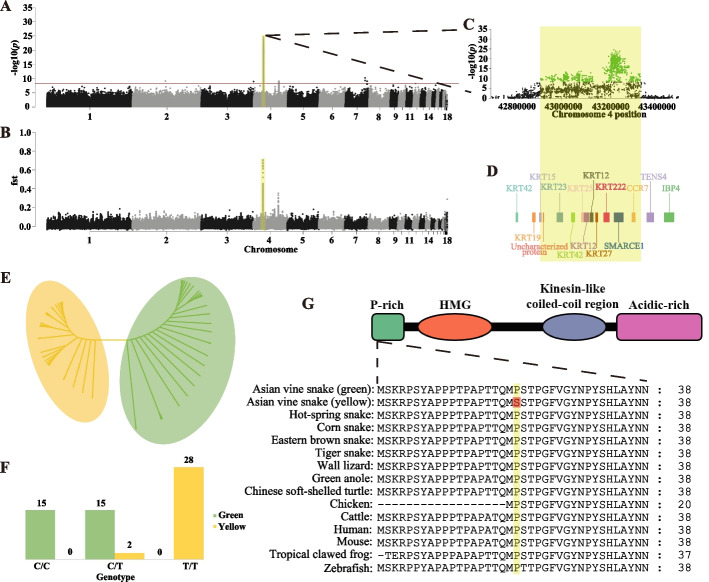
Whole-genome sequencing identification of amino acid substitution P20S in SMARCE1 on chromosome 4, associated with skin color differences. A, B Manhattan plot showing a single region on Chr04, significantly associated with color differences between morphs. Red dash indicates Bonferroni-corrected critical p-value (−log10(p) = 8.4). C Association signals of GWAS analysis and genetic differentiation (Fst) in significant signal region. D Gene models within significant signal region. E Maximum-likelihood tree constructed by SNPs within significant signal region. F Correlations between Ahaetulla prasina skin color phenotypes and genotypes of SMARCE1 p.P20S. G Schematic and partial alignment of SMARCE1 showing location of P20S in an evolutionarily conserved region within a proline-rich structure across vertebrates