
- Title
-
Tricyclic SpiroLactams Kill Mycobacteria In Vitro and In Vivo by Inhibiting Type II NADH Dehydrogenases
- Authors
- Dam, S., Tangara, S., Hamela, C., Hattabi, T., Faïon, L., Carre, P., Antoine, R., Herledan, A., Leroux, F., Piveteau, C., Eveque, M., Flipo, M., Deprez, B., Kremer, L., Willand, N., Villemagne, B., Hartkoorn, R.C.
- Source
- Full text @ J. Med. Chem.

In vitro profile of TriSLas against replicating H37Rv (a–c) and nonreplicating ss18b (d). The bactericidal activity of (a) 11, (b) 12, and (c) bedaquiline was measured by cfu counting following 1 or 2 weeks of incubation with 1× MIC (filled circles, solid line), 2× MIC (filled triangles, dashed line), or 4× MIC (filled squares, dotted line). Data are mean and SEM of at least three independent biological replicates, and statistical analysis was performed with a paired t-test. (d) Bactericidal activity following 1-week incubation with TriSLAs and control antibiotics (isoniazid (INH) bedaquiline (BDQ), rifampicin (RIF)) against nonreplication ss18b-lux as measured by cfu counting. Data are mean and SEM of at least three independent biological replicates, and the statistical test to compare compound exposure to no compound control was performed using a two-tailed unpaired t test with Welch’s correction. The time-dependent decrease in ss18b-lux luminescence is available in Figure S3. |

Biochemical target validation of TriSLas and impact on the Mtb electron transport chain. (a) Compound 12 biochemical inhibition of NADH oxidation by recombinant Mtb MBP-Ndh (filled circles, solid line), MBP-Ndh(Y403C) (filled triangles, dashed line), and MBP-Ndh(Q334P) (filled squares, dotted line) overexpressed and purified using E. coli. Data are presented as a mean ± SD of at least three independent biological replicates. (b) Compound 12 biochemical inhibition of NADH oxidation by recombinant Mtb MBP-Ndh (filled circles, solid line) and MBP-NdhA (filled triangles, dashed line) overexpressed and purified using M. smegmatis. (c) Lineweaver–Burk plot showing noncompetitive inhibition of Ndh by 12 relative to menadione (n ≥ 3), (d) Lineweaver–Burk plot showing noncompetitive inhibition of Ndh by 12 relative to NADH (n ≥ 3), (e) Mtb NADH/NAD+ ratios measured following 2 and 24 h exposure to 11 (green-blue, 600 nM, 4× MIC), 12 (dark blue, 600 nM, 4× MIC), and bedaquiline (green, 1 μM, 4× MIC), compared to unexposed DMSO controls (black) (n ≥ 3), and (f) Mtb ATP concentrations measured following 24 h exposure to either 11 (green-blue), 12 (dark blue), and bedaquiline (green) (n ≥ 3). |
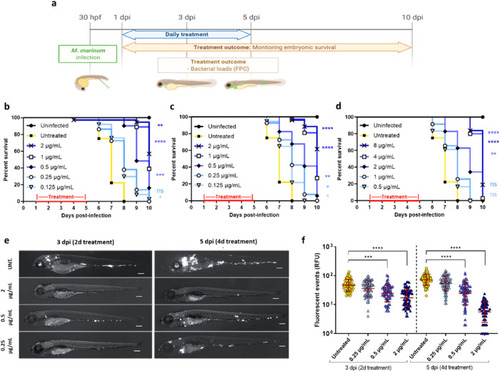
In vivo efficacy of TriSLas against M. marinum-infected embryonic zebrafish. (a) Schematic of the in vivo efficacy protocol showing the timeline of zebrafish embryo infection (200–250 colony-forming units (cfu) M. marinum expressing Wasabi), the exposure period to different concentrations of TriSLas (daily changes), and compound washout. hpf: hours post-fertilization; dpi: days post-infection; FPC: Fluorescence pixel count. (b–d) Survival curve ofM. marinum-infected zebrafish embryos monitored over the 10-day period post-infection, with and without 4-day treatment of (b) compound 11, (c) compound 12, and (d) compound 13. Survival curves are the cumulative results of three experiments covering more than 25 infected zebrafish per group. Statistics to compare treatment groups were performed using the log rank (Mantel–Cox) statistical test (*P < 0.05, **P < 0.01, ****P < 0.0001). (e) Representative sequential fluorescence images of M. marinum (Wasabi) infected zebrafish embryos following 2 or 4 days of treatment (3 and 5 dpi) with compound 12 at 0.25, 0.5, and 2 μg/mL, relative to untreated zebrafish (UNT). Scale bar, 210 μm. (f) M. marinum infection burden in zebrafish embryo as quantified following 2 (3 dpi) and 4 (5 dpi) days of compound 12 exposure (0.25, 0.5, and 2 μg/mL) by pixel count (fluorescent events) using the ImageJ software. The data presented are the cumulative data of three independent experiment (each containing 20 to 25 embryos per group), with each data point representing one infected zebrafish larva. The error bar represents the mean and standard deviations of the cumulative dataset. Statistical comparison of the different groups was performed using a Mann–Whitney’s t test, (***P < 0.001, ****P < 0.0001). PHENOTYPE:
|