
- Title
-
Wuliangye Baijiu but not ethanol reduces cardiovascular disease risks in a zebrafish thrombosis model
- Authors
- Zhu, H., Lan, C., Zhao, D., Wang, N., Du, D., Luo, H., Lu, H., Peng, Z., Wang, Y., Qiao, Z., Huang, Y., Sun, B.
- Source
- Full text @ NPJ Sci Food
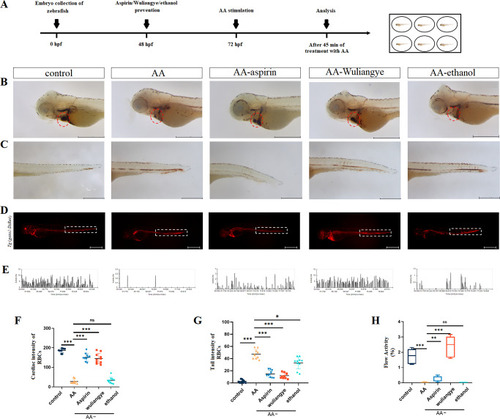
Wuliangye alleviates thrombosis in the AA-treated zebrafish.
A Time line of aspirin/Wuliangye (0.3% ethanol, v/v), 0.3% ethanol protection and AA treatment. Representative images (B) and quantification (F) of o-dianisidine staining at the heart regions of control, AA, AA-aspirin, AA-Wuliangye, and AA-ethanol groups (n = 10). The heart regions are circled by red dotted line. C, G Representative images (C) and quantification (G) of o-dianisidine staining at the tail regions control, AA, aspirin, Wuliangye and ethanol treated (n = 10). Scale bar = 500 μm. All data are presented with mean ± standard deviation (solid bar). D Blood cell aggregation of Tg (gata1:DsRed) zebrafish in control group, AA group, aspirin group, Wuliangye group and ethanol group. E Blood flow velocity frequency diagram of zebrafish in control, AA, aspirin, Wuliangye and ethanol treated. H Boxplots of blood flow velocity statistics of control, AA, AA-aspirin, AA-Wuliangye and AA-ethanol groups, the boxes are outlined from the first quartile to the third quartile, the center line that goes through the box is the median, the whiskers (small lines) go from each quartile towards the minimum or maximum value. Compared with the control group; compared with the model group, ns for not significant, *P < 0.05, **P < 0.01, ***P < 0.001 (t test). |
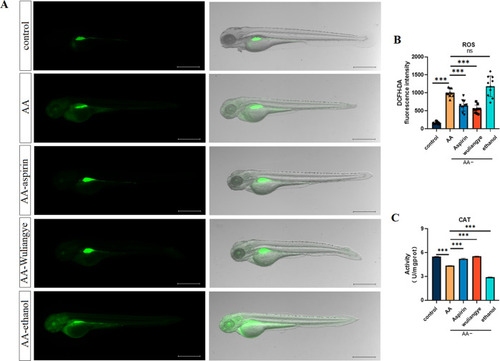
Wuliangye reduces the elevated levels of oxidative stress in the zebrafish thrombosis model.
Representative images (A) and quantification (B) of the fluorescence signals of DCFH-DA staining in different treatment groups (n = 10). Concentration of CAT (C) in zebrafish in different treatment groups. Scale bar = 500 μm. Compared with the control group; compared with the model group; data are presented as mean ± standard deviation (ns for not significant, ***P < 0.001, t test). |

RNA-seq data analysis.
A PCA of gene expression. B Venn diagram of gene counts expressed. C Significant DEG counts. D The KEGG pathway enrichment of DEGs between AA and control. E The KEGG pathway enrichment of DEGs between AA and AA-Wuliangye. F Pathway Enrichment Analysis of downregulated DEGs between AA and AA-Wuliangye groups. |

Changes of thrombus-related gene expression.
Compared with the control group; compared with the model group; data are presented as mean ± standard deviation (ns for not significant, *P < 0.05, **P < 0.01, ***P < 0.001, t test). |