FIGURE SUMMARY
Title

Zebrafish Avatars of rectal cancer patients validate the radiosensitive effect of metformin

Authors
Costa, B., Fernandez, L.M., Parés, O., Rio-Tinto, R., Santiago, I., Castillo-Martin, M., Parvaiz, A., Fior, R.
Source
Full text @ Front Oncol

Human CRC cells HCT116 were injected into the PVS of 2dpf zebrafish embryos. At 1dpi xenografts were submitted to 5FU chemotherapy (B), metformin (C), single radiation dose of 25Gy (D) or combinations of 25Gy+5FU (E) or 25Gy+MET (F). HCT116 xenografts were treated for 3 consecutive days and compared to non-irradiated and non-treated controls (A). Maximum Z projections of activated Caspase3 are shown in green (A’–F’). At 4dpi, cell proliferation (% mitotic figures), apoptosis (% activated Caspase3, green), and tumor size (number of tumor cells, DAPI, blue) were analyzed and quantified (G–I respectively). Results are the average of 2 independent experiments and are expressed as mean ± SEM. Each dot represents a xenograft and the total number of xenografts analyzed is indicated in the images (A–F). Dashed white line is delimitating the tumor of each xenograft. Scale bars represent 50µm. Statistical results: (ns) > 0.05, *P≦0.05, ****P≦0.0001. Results were compared with control with exception of those that have a bar to indicate the compared groups.

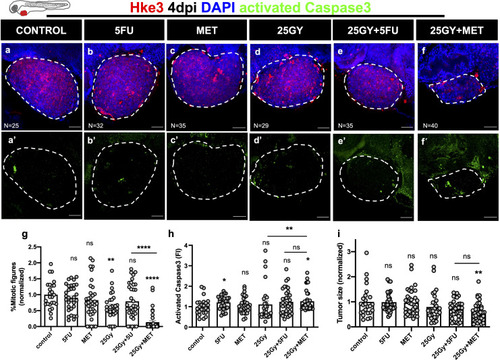
Human CRC cells Hke3 were injected into the PVS of 2dpf zebrafish embryos. At 1dpi xenografts were submitted to 5FU chemotherapy (B), metformin (C), single radiation dose of 25Gy (D) or combinations of 25Gy+5FU (E) or 25Gy+MET (F). HKe3 xenografts were treated for 3 consecutive days and compared to non-irradiated and non-treated controls (A). Maximum Z projections of activated Caspase3 are shown in green (A’–F’). At 4dpi, cell proliferation (% mitotic figures), apoptosis (% activated Caspase3, green), and tumor size (number of tumor cells, DAPI, blue) were analyzed and quantified (G–I respectively). Results are the average of 2 independent experiments and are expressed as mean ± SEM. Each dot represents a xenograft and the total number of xenografts analyzed is indicated in the images (A–F). Dashed white line is delimitating the tumor of each xenograft. Scale bars represent 50µm. Statistical results: (ns) > 0.05, *P≦0.05, ** P≦0.01, ****P≦0.0001. Results were compared with control with exception of those that have a bar to indicate the compared groups.

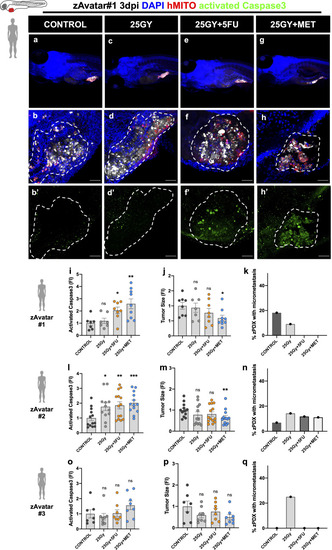
zAvatars were generated from rectum cancer surgical resected samples. One day after injection zAvatars were submitted to 25Gy radiation dose (C, D, D’), 25Gy+5FU (E, F, F’) or 25Gy+MET (G, H, H’) regimens, and compared with control (A, B, B’) At 3dpi, apoptosis (I, L, O), tumor size (J, M, P) and metastatic potential (K, N, Q) were analyzed. Tumor cells are labeled in white (cell tracker Deep Red), activated Caspase3 in green (B’–H’), DAPI in blue and human-mitochondria marker in red. Images correspond to zAvatar#1, and quantifications are shown for zAvatar#1, #2 and #3. Data is expressed as mean ± SEM and each dot represents a xenograft. Dashed white line is delimitating the tumor of each xenograft. Scale bars represent 50µm. Statistical results: (ns) > 0.05, *P≦0.05, **P≦0.01, ***P≦0.001. Results were compared with control with exception of those that have a bar to indicate the compared groups.

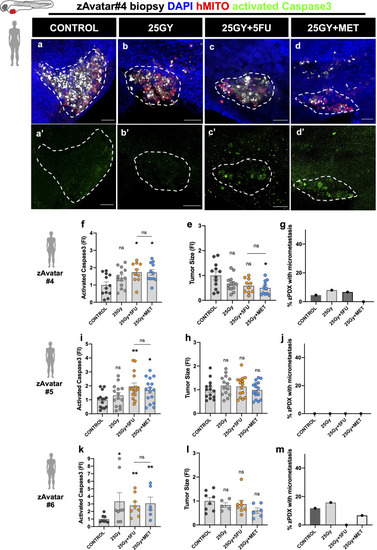
zAvatars were generated from naive rectal cancer biopsies. One day after injection zAvatars were submitted to 25Gy radiation dose (B, B’), 25Gy+5FU (C, C’) or 25Gy+MET (D, D’) regimens, and compared with control (A, A’) At 3dpi, apoptosis (F, I, K), tumor size (E, H, L) and metastatic potential (G, J, M) were analyzed. Tumor cells are labeled in white (Deep Red), activated Caspase3 in green (A’–D’), DAPI in blue and human-mitochondria marker in red. Images correspond to zAvatar#4, and quantifications are shown for zAvatar#4, #5 and #6. Data is expressed as mean ± SEM and each dot represents a xenograft. Dashed white line is delimitating the tumor of each xenograft. Scale bars represent 50µm. Statistical results: (ns) > 0.05, *P≦0.05, **P≦0.01. Results were compared with control with exception of those that have a bar to indicate the compared groups.

Acknowledgments
This image is the copyrighted work of the attributed author or publisher, and ZFIN has permission only to display this image to its users. Additional permissions should be obtained from the applicable author or publisher of the image. Full text @ Front Oncol