
- Title
-
Mild cold stress specifically disturbs clustering movement of DFCs and sequential organ left-right patterning in zebrafish
- Authors
- Liu, M., Zou, X., Fu, M., Bai, X., Zhao, Y., Chen, X., Wang, X., Wang, P., Huang, S.
- Source
- Full text @ Front Cell Dev Biol

Organ left-right patterning defects in embryos treated with mild cold stress. (A) Stage and time diagram of treatment with mild cold stress. (B) Heart morphogenesis in Tg (cmcl2:GFP) transgenic line and wild-type embryos upon cold stress. b1, normal-loop at 28.5°C (99.3%, n = 160); b2, normal-loop at 22°C (65.2%, n = 180, p < 0.001); b3, reversed-loop at 22°C (25.2%, n = 180, p < 0.01); b4, no loop at 22°C (9.6%, n = 180, p < 0.04); b5, normal-loop at 28.5°C (98.5%, n = 163); b6, normal-loop at 22°C (63.8%, n = 175, p < 0.001); b7, reversed-loop at 22°C (28%, n = 175, p < 0.01); b8, no loop at 22°C (8.2%, n = 175, p < 0.04). (C) Percentages of normal looping, reversed looping, and no looping of the heart in embryos treated at 28.5 and 22°C. A statistically significant difference (p < 0.05) could be seen in embryos treated at 28.5 vs 22°C. (D) Mild cold stress was found to cause liver LR defects using Tg (fabp10:GFP) and fabp10 probe staining. d1, normal liver at 28.5°C (100%, n = 192); d2, normal liver at 22°C (71.3%, n = 201, p < 0.001); d3, reversed liver at 22°C (15.8%, n = 201, p < 0.03); d4, liver bifida at 22°C (12.9%, n = 201, p < 0.05); d5, normal liver at 28.5°C (100%, n = 174); d6, normal liver at 22°C (69%, n = 172, p < 0.001); d7, reversed liver at 22°C (16.7%, n = 172, p < 0.03); d8, liver bifida at 22°C (14.3%, n = 172, p < 0.05). (E) Percentages of normal liver, reversed liver, and liver bifida in embryos treated at 28.5 and 22°C. A statistically significant difference (p < 0.05) could be seen in embryos treated with 28.5 vs 22°C. “*”p < 0.05; “**“p < 0.03; and “***“p < 0.001. |

Expression of left-sided Nodal signaling in control and embryos treated with mild cold stress. (A,B) Expression of spaw. a1, left-side spaw at 28.5°C (100%, n = 128); a2, left-side spaw at 22°C (22.4%, n = 134, p < 0.001); a3, bilateral spaw at 22°C (14.9%, n = 134, p < 0.03); a4, decreased expression of spaw at 22°C (63%, n = 134, p < 0.001). (C,D) Lefty1 is expressed in the left telencephalon (yellow arrow), left heart field (red arrow), trunk midline, and tail midline (black arrow). c1, normal lefty1 at 28.5°C (100%, n = 125); c2, normal lefty1 at 22°C (27.3%, n = 117, p < 0.001); c3, decreased expression of lefty1 at 22°C (24.2%, n = 117, p < 0.01); c4, absent lefty1 at 22°C (48.5%, n = 117, p < 0.002). (E,F) Lefty2 is expressed in left heart field (red arrow) at 18 SS. e1, normal lefty2 at 28.5°C (100%, n = 131); e2, normal lefty2 at 22°C (14.6%, n = 124, p < 0.001); e3, decreased expression of lefty2 at 22°C (41.5%, n = 124, p < 0.001); e4, absent lefty2 at 22°C (43.9%, n = 124, p < 0.001). “**“p < 0.03; “***“p < 0.001. |

KV morphogenesis and ciliogenesis in embryos treated with mild cold stress. (A,B) Morphology of KV. a1, normal KV at 28.5°C (100%, n = 133); a2, smaller KV at 22°C (63.6%, n = 137, p < 0.001); a3, tiny/absent KV at 22°C (36.4%, n = 137, p < 0.002). (C) Number and length of cilia. C1, cilia at 28.5°C (92.3%, n = 13); c2, cilia at 22°C (61.5%, n = 13, p < 0.001); c3, cilia at 22°C (38.5%, n = 13, p < 0.003). (D) Statistical chart for cilia number in KV. n = 13, p < 0.001 (E) Statistical chart for cilia length in KV. n = 12. Ns, not significant; “***“p < 0.001. |
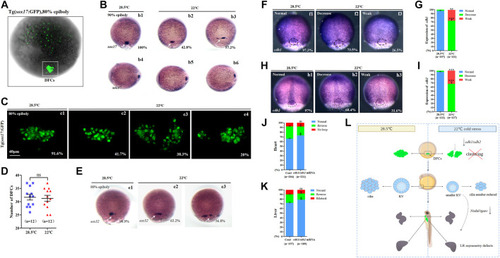
Expression of sox17, sox32, cdh1, and cdh2. (A) GFP is expressed in endodermal cells and DFCs at 80% epiboly in Tg (sox17:GFP) transgenic line (DFCs are circled with a white square). (B) Expression of sox17 was examined using WISH at 80% epiboly. b1, normal sox17 at 28.5°C (100%, n = 67); b2, normal sox17 at 22°C (42.8%, n = 74, p < 0.002); b3 dispersed expression of sox17 at 22°C (57.2%, n = 74, p < 0.001). DFCs (white arrow). (C) Number DFCs and migration situation of DFCs. C1, DFCs with normal migration at 28.5°C (91.6%, n = 12); c2, DFCs with normal migration at 22°C (41.7%, n = 12, p < 0.003); c3, dispersed DFCs at 22°C (38.3%, n = 12, p < 0.002); c4: dispersed DFCs at 22°C (20%, n = 12, p < 0.004). Scale bar, 40 μm. (D) Statistical analysis of DFC number. n = 12; ns, not significant (E) Expression of sox32 at 80% epiboly. e1, normal sox17 at 28.5°C (98.9%, n = 64); e2, normal sox17 at 22°C (63.2%, n = 70, p < 0.01); e3, dispersed expression of sox17 at 22°C (36.8%, n = 70, p < 0.03). DFCs (white arrow). (F) Expression of cdh1 at 80% epiboly. f1, normal cdh1 at 28.5°C (97.3%, n = 107); f2, decreased expression of cdh1 in the DFC field at 22°C (73.5%, n = 111, p < 0.001); f3, weak expression of cdh1 in the DFC field at 22°C (26.5%, n = 111, p < 0.01). DFC field (white circle). (G) Percentages of normal, decreased, and weak expression of cdh1 in embryos treated at 28.5°C or 22°C. A statistically significant difference (p < 0.01) could be seen between the embryos treated at 28.5 vs 22°C. (H) Expression of cdh2 in 80% epiboly. h1, normal cdh2 at 28.5°C (97%, n = 122); h2, decreased expression of cdh1 in the DFC field at 22°C (68.4%, n = 127, p < 0.001); h3, weak expression of cdh1 in the DFC field at 22°C (31.6%, n = 127, p < 0.003). DFC field (white circle). (I) Percentages of normal, decreased, and weak expression of cdh2 in embryos treated at 28.5°C or 22°C. A statistically significant difference (p < 0.003) could be seen between the embryos treated at 28.5 vs 22°C. (J) Percentage of normal looping, reversed looping, and no looping of the heart in embryos treated at 22°C (as control) and embryos treated at 22°C plus overexpression of cdh1/cdh2 mRNA in DFCs. A statistically significant difference (p < 0.05) could be seen between control embryos and embryos injected with cdh1/cdh2 mRNA. (K) Percentage of normal liver, reversed liver, and liver bifida in embryos treated at 22°C and embryos treated at 22°C plus overexpression of cdh1/cdh2 mRNA in DFCs. A statistically significant difference (p < 0.05) could be seen between them. (L) Mechanism diagram. Ns, not significant; “*“p < 0.05; “**“p < 0.03; and “***“p < 0.001. |