
|
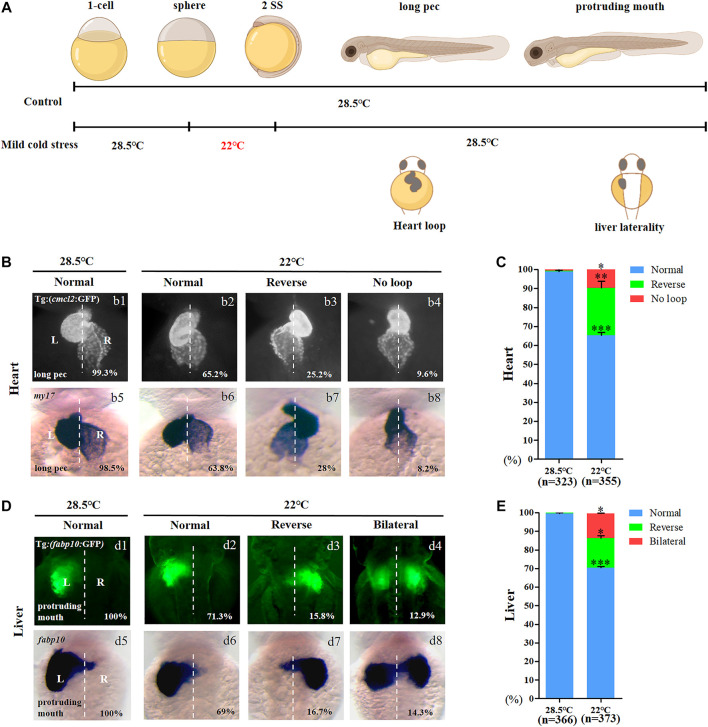
FIGURE 1
Organ left-right patterning defects in embryos treated with mild cold stress. (A) Stage and time diagram of treatment with mild cold stress. (B) Heart morphogenesis in Tg (cmcl2:GFP) transgenic line and wild-type embryos upon cold stress. b1, normal-loop at 28.5°C (99.3%, n = 160); b2, normal-loop at 22°C (65.2%, n = 180, p < 0.001); b3, reversed-loop at 22°C (25.2%, n = 180, p < 0.01); b4, no loop at 22°C (9.6%, n = 180, p < 0.04); b5, normal-loop at 28.5°C (98.5%, n = 163); b6, normal-loop at 22°C (63.8%, n = 175, p < 0.001); b7, reversed-loop at 22°C (28%, n = 175, p < 0.01); b8, no loop at 22°C (8.2%, n = 175, p < 0.04). (C) Percentages of normal looping, reversed looping, and no looping of the heart in embryos treated at 28.5 and 22°C. A statistically significant difference (p < 0.05) could be seen in embryos treated at 28.5 vs 22°C. (D) Mild cold stress was found to cause liver LR defects using Tg (fabp10:GFP) and fabp10 probe staining. d1, normal liver at 28.5°C (100%, n = 192); d2, normal liver at 22°C (71.3%, n = 201, p < 0.001); d3, reversed liver at 22°C (15.8%, n = 201, p < 0.03); d4, liver bifida at 22°C (12.9%, n = 201, p < 0.05); d5, normal liver at 28.5°C (100%, n = 174); d6, normal liver at 22°C (69%, n = 172, p < 0.001); d7, reversed liver at 22°C (16.7%, n = 172, p < 0.03); d8, liver bifida at 22°C (14.3%, n = 172, p < 0.05). (E) Percentages of normal liver, reversed liver, and liver bifida in embryos treated at 28.5 and 22°C. A statistically significant difference (p < 0.05) could be seen in embryos treated with 28.5 vs 22°C. “*”p < 0.05; “**“p < 0.03; and “***“p < 0.001.