FIGURE SUMMARY
Title

Volumetric optoacoustic neurobehavioral tracking of epileptic seizures in freely-swimming zebrafish larvae

Authors
Özsoy, Ç., Hotz, A.L., Rieser, N.N., Chen, Z., Deán-Ben, X.L., Neuhauss, S.C.F., Razansky, D.
Source
Full text @ Front. Mol. Neurosci.

(A) Lay-out of the experimental system. (B) Volumetric optoacoustic tomography (OAT) image of the 5 dpf control zebrafish larva. Maximum intensity projections (MIPs) for top (left) and tilted (right) views are shown. (C) Corresponding widefield fluorescence (FL) image of the same zebrafish larva. (D) MIPs along the z axis of the OAT images reconstructed with frequency bands of 0.1–5 and 5–25 MHz. The merged image is also shown. Scalebars–2 mm.

Imaging of epileptic seizure propagation in 5 dpf zebrafish larvae. (A) Optoacoustic tomography (OAT) images at 3, 8, 14, and 50 s after the beginning of the acquisition–maximum intensity projections (MIPs) along the z direction are shown. E, eyes; B, brain; DF, dorsal fin. (B) Corresponding FL images. (C) Temporal profiles of the differential OA [ΔOA/OA0 = (OA–OA0)/OA0, green and blue plots] and the differential FL [ΔF/F0 = (F–F0)/F0, light green and light blue plots] signals for two different points in the hindbrain (green and light green arrows) and forebrain (blue and light blue arrows). Scalebars–2 mm.

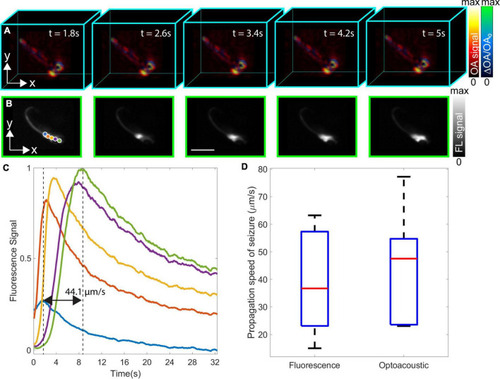
Dual-modality volumetric optoacoustic tomography (OAT) and fluorescence (FL) imaging of neuronal activation in the eaat2a–/– mutant zebrafish larva and estimation of epileptic seizure propagation speed. (A) Relative optoacoustic (OA) signal changes (ΔOA/OA0) from five consecutive time points superimposed on the normalized volumetric OAT image. Light-induced stimulation was initiated at t = 0 s. (B) The corresponding time-lapse FL image sequence. (C) Spatio-temporal plots representing seizure propagation in five different points labeled in blue, orange, yellow, purple, and green colors in panel B. The FL signal peak of blue and green plots corresponds to the 3 and 8 s time points with the speed of seizure propagation calculated as 44.1 μm/s. (D) Boxplots of the propagation speed of epileptic seizures calculated from the eaat2a–/– mutant zebrafish larvae (5 dpf) (n = 7) [FL; mean: 39.6, mean ± σ: (58.6001, 20.5713) μm/s versus OA; mean: 43.5, mean ± σ: (64.3477, 22.5951) μm/s]. Scale bar, 2 mm.

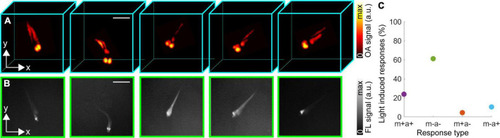
Aberrant swimming activity of the freely moving eaat2a–/– mutant zebrafish larva following light-induced stimulation at 488 nm. (A) Volumetric optoacoustic (OA) images at 0, 0.2, 1.2, 2.6, and 8 s after the stimulation beginning. (B) Corresponding fluorescence (FL) images. Scalebars–3 mm. (C) Light induced different types of responses (%) following 67 total stimulations in 12 eaat2a–/– mutant zebrafish larvae.

Acknowledgments
This image is the copyrighted work of the attributed author or publisher, and ZFIN has permission only to display this image to its users. Additional permissions should be obtained from the applicable author or publisher of the image. Full text @ Front. Mol. Neurosci.