- Title
-
PLAAT1 inhibits type I interferon response via degradation of IRF3 and IRF7 in Zebrafish
- Authors
- Zhao, X., Huang, W., Shi, Y., Guo, J., Xiao, H., Ji, N., Feng, J., Dang, H., Zou, J.
- Source
- Full text @ Front Immunol
|
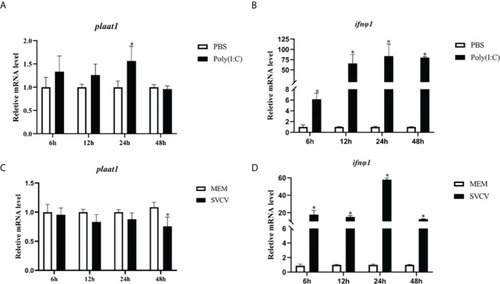
Plaat1 expression in ZF4 cells in response to poly(I:C) and SVCV infection. ZF4 cells were seeded in 6-well plates and cultured overnight. The cells were transfected with poly(I·C) (2 μg) or infected with SVCV (3.16 × 10⁶ TCID50/mL). Gene expression of plaat1 (A, C) and ifnφ1 (B, D) was analyzed by qRT-PCR. Data are presented as mean ± SEM, n=3. *P<0.05 is considered significant difference. |
|
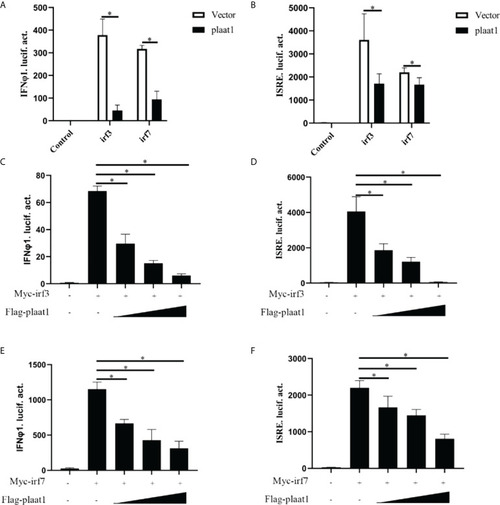
Zebrafish PLAAT1 negatively regulates IFN expression and signaling. (A, B) Overexpression of plaat1 suppressed the activity of IFNφ1 (A) or ISRE (B) luciferase reporter induced by SVCV infection or poly (I:C). EPC cells were seeded in 24-well plates and transfected with IFNφ1pro-Luc (250 ng) or ISRE-Luc (250 ng) plus pRL-TK (25 ng) and Flag-plaat1 or pcDNA-3.1 (empty vector, 250 ng). After 24 h, the cells were infected with SVCV (3.16 × 10⁶ TCID50/mL) or transfected with poly (I:C) (2 μg/mL). After 24 h, luciferase reporter activity was analyzed. (C) The EPC cells were transfected with ISRE-Luc (250 ng) plus pRL-TK (25 ng) and Flag-plaat1or pcDNA-3.1 (empty vector, 250 ng). At 24 h post-transfection, cells were treated with PBS or IFNφ1 protein (100 ng/mL) for 6 h. Data are shown as mean ± SEM (n=3). *P<0.05 is considered significant difference. |
|
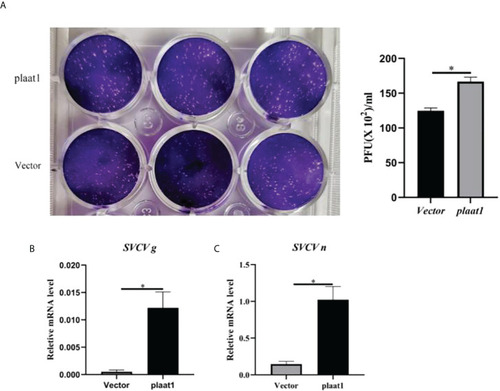
Overexpression of plaat1 promotes SVCV replication in the EPC cells. The EPC cells were transfected with 2 μg of Flag-plaat1 plasmid or empty vector (pcDNA3.1). At 24 h post-transfection, cells were infected with SVCV (3.16 × 10⁶ TCID50/mL) for 24 h. Cell culture media were collected for plaque assay (A). The mRNA levels of the SVCV g (B) and SVCV n (C) genes were analyzed by qRT-PCR. Data are shown as mean ± SEM (n=3). *P<0.05 is considered significant difference. |
|
PLAAT1 targets IRF3 and IRF7 to suppress IFN response. (A, B) Overexpression of plaat1 inhibits the activation of IFNφ1/ISRE promoters induced by irf3 and irf7. EPC cells were transfected with indicated plasmids and collected at 24 h for luciferase assay. (C–F) Different doses of plaat1 plasmid (250, 500, or 1000 ng) were used for transfection. Data are expressed as mean ± SEM (n=3). Data are shown as mean ± SEM (n=3). *P<0.05 is considered significant difference. |
|
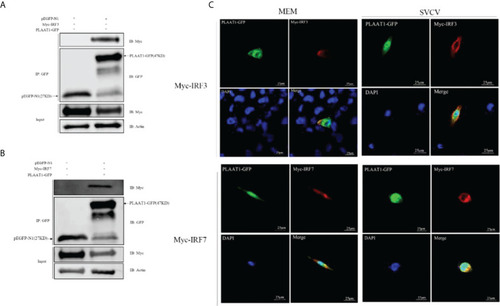
PLAAT1 interacts with IRF3 and IRF7. (A, B) EPC cells were transfected with the indicated plasmids (5 μg each). After 24 h, cell lysates were immunoprecipitated (IP) with α-GFP affinity resin. The immunoprecipitates and cell lysates were analyzed by immunoblotting (IB). (C) PLAAT1 co-localized with IRF3 and IRF7 in the cytoplasm. with or without SVCV infection. EPC cells were plated onto coverslips in 6-well plates and transfected with PLAAT1-GFP (2 μg) and Myc-IRF3 (2 μg) or Myc-IRF7 (2 μg) plasmids. After 24 h, the cells were left untreated (MEM), infected with SVCV. After an additional 24 h, cells were stained with DAPI (blue) and photographed under a confocal microscope. Green and red colors indicate overexpressed PLAAT1 and IRF3 or IRF7, respectively. Scale bar=25 μm. All experiments were repeated at least three times with similar results. |
|
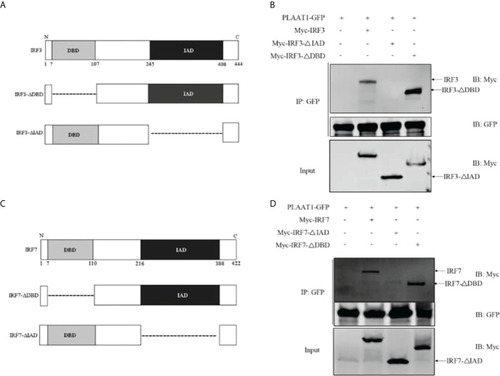
PLAAT1 interacts with the IAD of IRF3 and IRF7. (A) Schematic description of IRF3, IRF3-ΔDBD and IRF3-ΔIAD. (B) PLAAT1 was immunoprecipitated with IRF3, IRF3-ΔDBD. (C) Schematic description of IRF7, IRF7-ΔDBD and IRF3-ΔIAD. (D) PLAAT1 was immunoprecipitated with IRF7 and IRF7-ΔDBD. EPC cells were transfected with the indicated plasmids (5 μg each). At 24 h, cell lysates were analyzed by immunoblotting (IB) with the respective Abs. |
|
PLAAT1 promotes degradation of IRF3 and IRF7. (A, B) Overexpression of PLAAT1 initiated degradation of IRF3 and IRF7 in a dose-dependent manner. EPC cells were transfected with Myc-IRF3 or Myc-IRF7 (1 μg) plus pcDNA3.1 (1 μg) or different amount of Flag-PLAAT1 plasmid (0.5, 1 and 2 μg). Cells were analyzed after 24 h by IB. (C, D) 3-MA inhibits PLAAT1 induced degradation of IRF3 and IRF7. EPC cells were transfected with Myc-IRF3 (1 μg) or Myc-IRF7 (1 μg) plus Flag-PLAAT1 (1 μg) or pcDNA3.1 (1 μg). At 18 h, cells were treated with dimethyl sulfoxide (DMSO)(control), MG132 (25 μM), 3-MA (10 mM) or CQ (50 μM) for 6 h, and analyzed by IB. The numbers above the images indicate the ratio of the density of protein bands of IRF3 or IRF7 against that of β-actin. |

