
- Title
-
Functional testing of BMP pathway variants identified on whole exome sequencing in a patient with delayed-onset fibrodysplasia ossificans progressiva (FOP) using ACVR1R206H -specific human cellular and zebrafish models
- Authors
- Wentworth, K.L., Lalonde, R.L., Groppe, J.C., Brewer, N., Moody, T., Hansberry, S., Taylor, K., Shore, E.M., Kaplan, F.S., Pignolo, R.J., Yelick, P.C., Hsiao, E.C.
- Source
- Full text @ J. Bone Miner. Res.

FOP cohort CAJIS scores. Graphic representation of CAJIS versus age for our FOP cohort at the time of DNA collection and whole‐exome sequencing. Mean and 95% confidence intervals are included. ▲ indicates the CAJIS score for the index late‐onset FOP patient. |
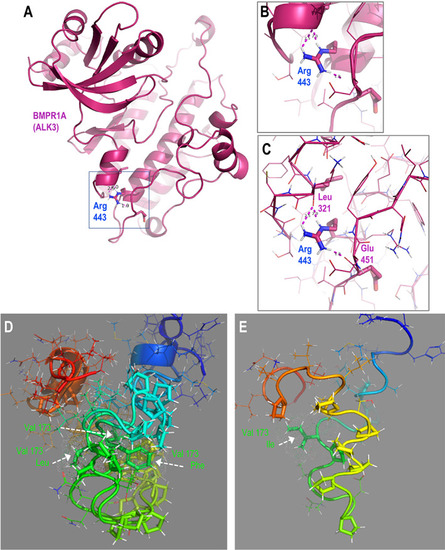
Structural predictions of BMPR1AR443C and ACVR2AV173I suggest potential functional roles for these protein variants. (A) Structure‐based homology model of the ordered cytoplasmic polypeptide of BMPR1A (regulatory segment and kinase domain). (B) Zoomed view of inset box in A showing the position of the Arg443 residue in the alpha‐helical C‐lobe scaffold, depicted with cartoon representation. (C) View as in B, with the polypeptide backbone represented with ribbon to show the hydrogen‐bonding network between the Arg443 side‐chain hydrogen donors and the backbone acceptors of Leu321 and Glu451. (D,E) De novo predicted structural models for cytoplasmic juxtamembrane segments of ACVR2A wild‐type and V173I forms. (D) Superposition of models for wild‐type (GUU) and putative V173L (CUU), V173F (UUU) segments. (E) Model of V173I (AUU) variant. Note the inversion of the position of the proline‐rich subsegment of the isoleucine variant relative to those in the models for the other bulky hydrophobic (valine, leucine) side‐chains at residue 173 (vertically extended foreground yellow, background green). Wild‐type amino acid sequence: N‐RHHKMAYPPVL V PTQDPGPPPPSPLLGLKPLQLL‐C; residue 173 in bold, underlined; 10 proline residues (10/34) in italics. Polypeptide segments colored in rainbow, N‐terminal blue to C‐terminal red. Side‐chains of residue 173 and the 10 prolines depicted with sticks, all others are lines with exception of the two glycine residues (hydrogens not rendered). |

BMPR1AR443C does not alter ACVR1R206H‐induced BMP signaling in ACVR1R206H HEK 293T cells or Tg(R206Ha) zebrafish, but BMPR1A knockdown in ACVR1R206H HEK 293T cells decreases BMP signaling. (A) pSMAD 1/5/9 levels normalized to GAPDH in nontransfected ACVR1 R206H HEK 293T cells stimulated with BMP4 or AA. The fold‐change between NS and BMP4‐ or AA‐stimulated cells is 3.69 and 8.81, respectively, for ACVR R206H HEK 293T cells. p‐values are shown numerically with p < 0.05 denoting significance using unpaired, parametric t tests with Welch's correction. (B) pSMAD 1/5/9 levels normalized to GAPDH in nontransfected ACVR1 R206H HEK 293T cells after transient transfection with siRNA targeting BMPR1A and stimulation with either BMP4, activin A (AA), or nonstimulated. N ≥ 5 for each condition. p‐values are shown numerically with p < 0.05 denoting significance using unpaired, parametric t tests with Welch's correction. (C) Representative Western blots showing pSMAD 1/5/9 levels normalized to GAPDH loading control in HEK 293T ACVR1 R206H cells after transient transfection with siRNA targeting BMPR1A and stimulation with either BMP4 or AA. (▲ = duplicate NT/AA sample repeated across all 3 membranes for normalization); n ≥ 5 replicates for each condition. Horizontal boxes denote Western blots that were run on the same membrane but cut between 50 kD and 37 kD prior to separate pSMAD 1/5/9 and GAPDH antibody probing. p‐values are shown numerically with p < 0.05 denoting significance using unpaired, parametric t tests with Welch's correction. (D) pSMAD 1/5/9 levels normalized to GAPDH and BMPR1A‐HA protein tag in ACVR1 R206H HEK 293T cells after transient transfection with BMPR1A WT or BMPR1A R443C plasmids; n ≥ 5 biological replicates for each condition. (E) Representative Western blot demonstrating pSMAD 1/5/9 levels normalized to GAPDH and BMPR1A‐HA protein tag in ACVR1 R206H HEK 293T cells after transient transfection with BMPR1A WT or BMPR1A R443C plasmids (representative of n = 6 biological replicates). Horizontal boxes denote Western blots that were run on the same membrane but cut between 50 kD and 37 kD prior to pSMAD 1/5/9 and GAPDH antibody probing. p‐values are shown numerically with p < 0.05 denoting significance using unpaired, parametric t tests with Welch's correction. (F) (Columns 1–4) Percent of dorsalized embryos in WT (non‐Tg(ACVR1‐R206Ha)) zebrafish in a bmpr1aa; bmpr1ab mutant background after injection with either BMPR1A WT (90 ng/μL) or BMPR1A R443C (90 ng/μL) human mRNA. Kruskal‐Wallis test was performed and, statistical significance observed between columns 6 + 8 (p = 0.0004 (Columns 1–4, n = 58, 63, 60, 105 embryos, respectively). (Columns 5–8) Percent of ventralized embryos in Tg(ACVR1‐R206Ha) zebrafish after injection with human BMPR1A WT or BMPR1A R443C mRNA). Kruskal‐Wallis test was performed, statistical significance observed between columns 2 and 4 (p < 0.0001) (Columns 5–8, n = 50, 71, 39, and 71 embryos, respectively). (G,H) Representative dorsalized non‐Tg(ACVR1‐R206Ha) embryos in bmpr1aa; bmpr1ab mutant background following BMPR1A WT (90 ng/μL) or BMPR1A R443C (90 ng/μL) human mRNA injection. Parental genotypes are indicated above in F. BMPR1A WT / R443C mRNAs were injected into separate clutches, and uninjected controls were scored from each clutch. Transgenic‐positive and transgenic‐negative embryos were sorted via mCherry fluorescence. |
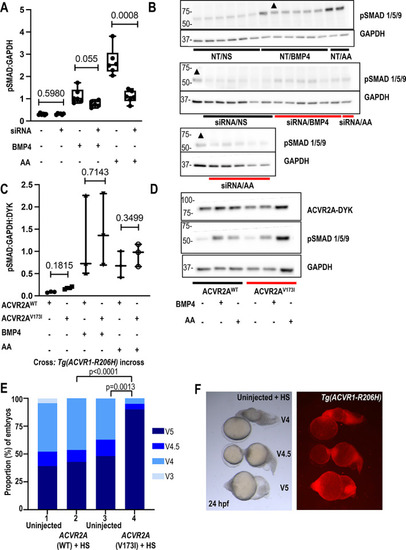
ACVR2A V173I increases ACVR1R206H‐induced BMP signaling in Tg(R206Ha) zebrafish but does not alter signaling in ACVR1 R206H HEK 293T cells, while ACVR2A knockdown decreases activin A‐induced signaling in ACVR1 R206H HEK 293T cells. (A) pSMAD 1/5/9 levels normalized to GAPDH in ACVR1 R206H HEK 293T cells after transient transfection with siRNA targeting ACVR2A and stimulation with either BMP4, activin A (AA), or nonstimulated. N ≥ 5 biological replicates for each condition. Values of p are shown numerically with p < 0.05 denoting significance using unpaired, parametric t tests with Welch's correction. (B) Western blot showing pSMAD 1/5/9 levels normalized to GAPDH loading control in ACVR1 R206H HEK 293T cells after transient transfection with siRNA targeting ACVR2A and stimulation with either BMP4 or AA. (▲ = duplicate NT/BMP4 sample repeated across all 3 membranes for normalization). Horizontal boxes denote Western blots that were run on the same membrane but cut between 50 kD and 37 kD prior to separate pSMAD 1/5/9 and GAPDH antibody probing. Values of p are shown numerically with p < 0.05 denoting significance using unpaired, parametric t tests with Welch's correction. (C) pSMAD 1/5/9 levels normalized to GAPDH and ACVR2A‐DYK protein tag in ACVR1 R206H HEK 293T cells after transient transfection with ACVR2A WT or ACVR2A V173I plasmids. Values of p are shown numerically with p < 0.05 denoting significance using unpaired, parametric t tests with Welch's correction. (D) Representative Western blot demonstrating pSMAD 1/5/9 levels normalized to GAPDH and ACVR2A‐DYK protein tag in HEK 293T ACVR1 R206H cells after transient transfection with ACVR2A WT or ACVR2A V173I plasmids (representative of n = 3 biological replicates). Values of p are shown numerically with p < 0.05 denoting significance using unpaired, parametric t tests with Welch's correction. (E) (Columns 1–4) Percent ventralized embryos after injection of ACVR2A WT (90 ng/μL) or ACVR2A V173I (90 ng/μL) mRNA into Tg(ACVR1‐R206Ha). Kruskal‐Wallis test was performed, statistical significance observed between columns 2 and 4 (p < 0.0001), and columns 3 and 4 (p = 0.0013) (Columns 1–4, n = 46, 56, 27, and 60 embryos, respectively). Parental genotypes are indicated above each column. (F) Uninjected ventralized (V5, V4.5, V4) heat‐shocked Tg(ACVR1‐R206Ha) embryos. ACVR2A WT/V173I mRNAs were injected into separate clutches, and uninjected controls were scored from each clutch. Transgenic‐positive and transgenic‐negative embryos were sorted via mCherry fluorescence. |

Co‐knockdown of BMPR1A and ACVR2A decreases BMP signaling in ACVR1 R206H HEK cells after stimulation with BMP4 or AA; knockdown of acvr2aa; acvr2ab; bmpr1aa; bmpr1ab partially rescues the ventralization phenotype in Tg(ACVR1‐R206Ha) zebrafish. (A) pSMAD 1/5/9 levels normalized to GAPDH loading control in ACVR1 R206H HEK 293T cells after transient transfection with siRNA targeting both BMPR1A and ACVR2A, and after stimulation with either BMP4, activin A (AA), or nonstimulated. N = 6 biological replicates for each condition except n = 4 for co‐transfected AA. Values of p are shown numerically with p < 0.05 denoting significance using unpaired, parametric t tests with Welch's correction. (B) acvr2aa; acvr2ab and bmpr1aa; bmpr1ab knockdown in Tg(ACVR1‐R206Ha) fish partially rescues the ventralization phenotype (Columns 1–4). Percent ventralized heat‐shocked (HS)‐Tg(ACVR1‐R206H) embryos in bmpr1aa; bmpr1ab mutant background after co‐injection with acvr2aa; acvr2ab or control MOs. Kruskal‐Wallis test was performed, statistical significance observed between columns 1 and 2 (p < 0.0001) and columns 2 and 4 (p < 0.0001) (Columns 1–4, n = 24, 46, 73, and 88, respectively). Genotyping was used to confirm that 6/10 V3 ventralized embryos were bmpr1aa −/− ; bmpr1ab −/− mutants as compared to 1/8 and 0/6 for more severe V4 and V5 ventralized embryos, respectively (see Fig. S7B). Percent dorsalized non‐Tg(ACVR1‐R206H) embryos in bmpr1aa; bmpr1ab mutant background after co‐injection of acvr2aa; acvr2ab or control morpholinos (MOs). Kruskal‐Wallis test was performed and statistical significance was observed between columns 5 and 6 (p < 0.0001) and columns 6 and 8 (p < 0.0001) (Columns 5–8, n = 49, 78, 57, and 71, respectively). (C,D) Ventralized (V3, V4, V5) HS‐Tg(ACVR1‐R206H) embryos in bmpr1aa; bmpr1ab mutant background following acvr2aa; acvr2ab MO co‐injection. (E) Dorsalized non‐Tg(ACVR1‐R206H) embryos in bmpr1aa; bmpr1ab mutant background following acvr2aa; acvr2b MO co‐injection. Parental genotypes are presented above each column in B. Control and acvr2aa; acvr2ab MOs were injected into separate clutches, and uninjected controls were scored from each clutch. Transgenic‐positive and transgenic‐negative embryos were sorted via mCherry fluorescence. MO = morpholino. |

Summary of human cellular and zebrafish functional studies. Summary of the functional effects of BMPR1A R443C and ACVR2A V173I on ACVR1 R206H signaling in human ACVR1 R206H and ACVR1 WT HEK 293T cells models and zebrafish models of FOP. |