FIGURE SUMMARY
Title

Kuoxin Decoction promotes lymphangiogenesis in zebrafish and in vitro based on network analysis

Authors
Peng, L., Ma, M., Dong, Y., Wu, Q., An, S., Cao, M., Wang, Y., Zhou, C., Zhou, M., Wang, X., Liang, Q., Wang, Y.
Source
Full text @ Front Pharmacol

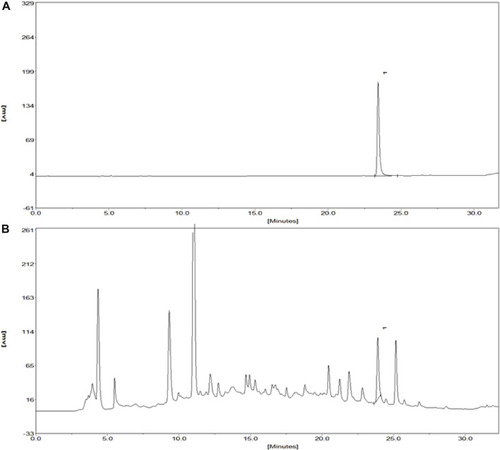
Chromatograms of the Salvianolic acid B standard and extract of KXF. (A). Chromatogram of the Salvianolic acid B standard at 286 nm. The retention time of the Salvianolic acid B standard was 23.42 min, and the peak height and peak area of which were 178.11 and 1785.6 mV*sec, respectively. (B). Chromatogram of the extract of KXF at 286 nm. (1). Salvianolic acid B.

(A). Component-target–disease network diagram. Cross-references to KXF and DCM targets to identify potential targets of KXF associated with DCM. Red nodes represent DCM. The yellow node represents KXF. Green nodes represent the compounds in KXF. Purple nodes represent potential targets of KXF of DCM. (B). Protein–protein interaction network (PPI) shows the interactions between overlapping genes. The yellow node represents a gene, and the red line represents the interaction between genes. The larger the area covered by a gene, the more pronounced the effect of KXF has on that gene.

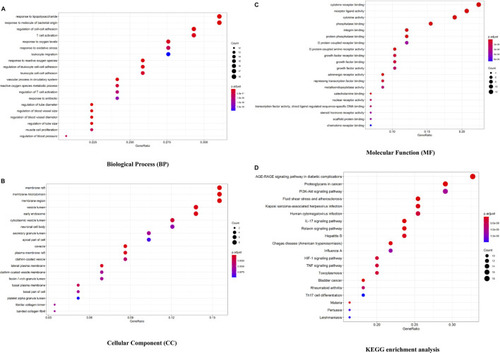
Bioconductor database-enriched pathways and GO entries. (A). GO enrichment entries in the top 20 about the biological process (BP). (B). GO enrichment entries in the top 20 about cellular component (CC). (C). GO enrichment entries in the top 20 about molecular function (MF). (D). KEGG enrichment entries in the top 20 (p< 0.05). The color of the bubble represents the value of p, and the size of the bubble represents the count of relative entries.

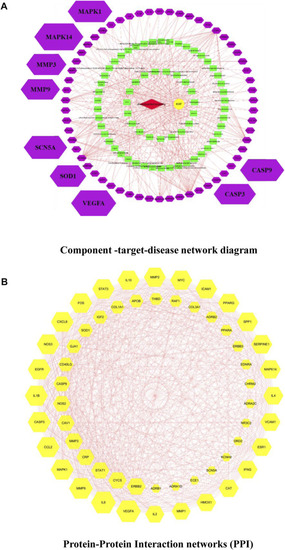
Medicinal material-component-target-signal pathway network. Blue nodes represent the 5 principal components of KXF, purple nodes represent active compounds, red nodes represent relative genes, and yellow nodes represent signaling pathways. 黄芪:Astragalus mongholicus Bunge (Huangqi), 黄精:Polygonatum kingianum Collett and Hemsl (Huangjing), 丹参:Salvia miltiorrhiza Bunge (Danshen), 桂枝:Neolitsea cassia (L.) Kosterm (Guizhi), 瓜蒌(皮):Trichosanthes kirilowii Maxim (Gualoupi).

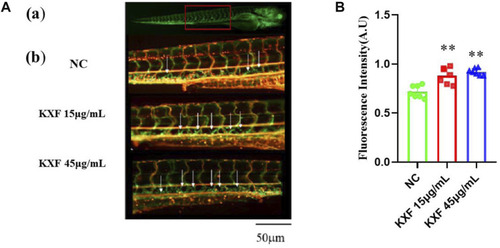
Toxicity analysis of KXF in zebrafish. Tg (Flila: egfp; Gata1: dsred) transgenic zebrafish of 48hpf was treated with different dosages of KXF for 48 h to determine the safe dosage of KXF. Quantitation of the survival zebrafish number. **p< 0.01 vs. control group.

KXF increased the lymphatic thoracic duct formation in zebrafish. (A). Confocal image of the 96 hpf. zebrafish vascular system. (A). The red-boxed region indicates the area of the confocal image (from the seventh or eighth to the 18th somite). (B). Representative confocal images show that KXF promoted the thoracic lymphatic duct formation in zebrafish, the white arrow indicates the thoracic lymphatic duct; (B). Quantitation of the fluorescence intensity of the thoracic lymphatic duct. **p< 0.01 vs. NC group.

Impaired lymphatic thoracic duct formation induced by VEGFR-3 kinase inhibitor (MAZ51) was rescued by KXF. (A). Representative confocal images show that KXF promoted the thoracic lymphatic duct formation in zebrafish. The white arrow indicates the thoracic lymphatic duct, and the white star indicates a lack of lymphatic vessels; (B). Quantitation of the fluorescence intensity of the thoracic lymphatic duct. * *p< 0.01 vs. model group.

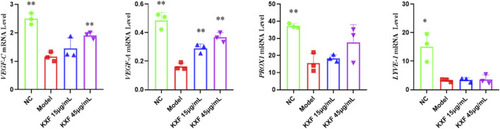
KXF promoted the expression of mRNAs related to the lymphatic vessel. The image represents the expression levels of VEGF-C, VEGF-A, PROX1, and LYVE-1 mRNA in normal zebrafish with the treatment of two dosages of KXF for 48 h. *p< 0.05 vs. NC group, **p< 0.01 vs. NC group.

KXF increased the expression of mRNAs associated with lymphatic vessels after zebrafish thoracic lymphatic vessels were damaged by the VEGFR-3 kinase inhibitor (MAZ51). After the pre-treatment of MAZ51 (6 h), the expression levels of VEGF-C, VEGF-A, PROX1, and LYVE-1 mRNA in impaired zebrafish with two dosages of KXF for 48 h. *p< 0.05 vs. Model group, **p< 0.01 vs. Model group.

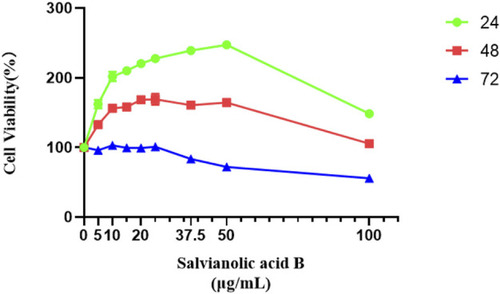
Salvianolic acid B promoted the proliferation of lymphatic endothelial cells. The image represents the viability of lymphatic endothelial cells treated with different dosages of Salvianolic acid B (5, 10, 15, 20, 25, 37.5, 50, and 100 μg/ml). The green curve represents the cell viability after 24 h of treatment with different concentrations of SAB. The red curve represents the cell viability after 48 h of treatment with different concentrations of SAB. The blue curve represents the cell viability after 72 h of treatment with different concentrations of SAB.

Salvianolic acid B promoted the migration of lymphatic endothelial cells. The image represents the changes in the scratch width after Salvianolic acid B treatment. (A). The images of the scratches before LECs were treated and after LECs were treated with three dosages of SAB (5, 10, and 20 μg/ml) for 24 h. The distance between two yellow lines is the width of the scratch. (B). Quantitation of migration rate. *p< 0.05 vs. Control group.

The protein expressions of VEGF-C and VEGFR-3. LECs were treated with different concentrations of SAB for 24h, and cell lysates were prepared and analyzed by western blot assay. (A). Quantitation of the protein expression of VEGF-C. (B). Quantitation of the protein expression of VEGFR-3 protein.

Salvianolic acid B promoted the protein expressions of VEGF-C and VEGFR-3 proteins in lymphatic endothelial cells under injury. After the LECs were treated with MAZ51 for 24 h to induce injury, along with the treatment of three dosages of SAB for 24 h, cell lysates were prepared and analyzed by western blot assay. (A). Quantitation of the protein expression of VEGF-C. (B). Quantitation of protein expression of VEGFR-3. **p< 0.01 vs. MAZ51 group; ***p< 0.001 vs. MAZ51 group; ****p< 0.0001 vs. MAZ51 group.

Acknowledgments
This image is the copyrighted work of the attributed author or publisher, and ZFIN has permission only to display this image to its users. Additional permissions should be obtained from the applicable author or publisher of the image. Full text @ Front Pharmacol