
Image
|
Figure Caption
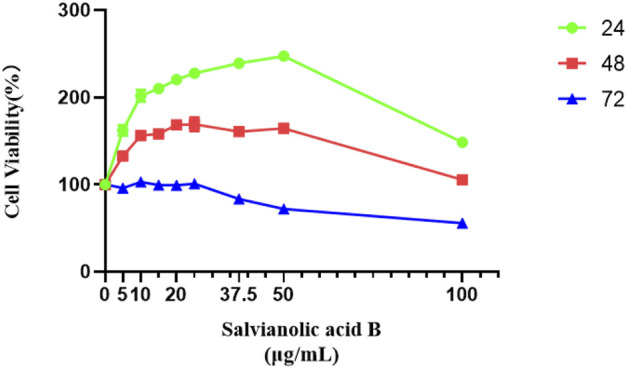
FIGURE 10
Salvianolic acid B promoted the proliferation of lymphatic endothelial cells. The image represents the viability of lymphatic endothelial cells treated with different dosages of Salvianolic acid B (5, 10, 15, 20, 25, 37.5, 50, and 100 μg/ml). The green curve represents the cell viability after 24 h of treatment with different concentrations of SAB. The red curve represents the cell viability after 48 h of treatment with different concentrations of SAB. The blue curve represents the cell viability after 72 h of treatment with different concentrations of SAB.
Acknowledgments
This image is the copyrighted work of the attributed author or publisher, and
ZFIN has permission only to display this image to its users.
Additional permissions should be obtained from the applicable author or publisher of the image.
Full text @ Front Pharmacol