
- Title
-
Pro-Angiogenetic Effects of Purified Extracts from Helix aspersa during Zebrafish Development
- Authors
- Zizioli, D., Mastinu, A., Muscò, A., Bonini, S.A., Finazzi, D., Avisani, R., Kron Morelli, G.B., Pecorelli, S., Memo, M.
- Source
- Full text @ Curr. Iss. Mol. Biol.

Exposure methods used as experimental plans: The transgenic Tg ( |

( |
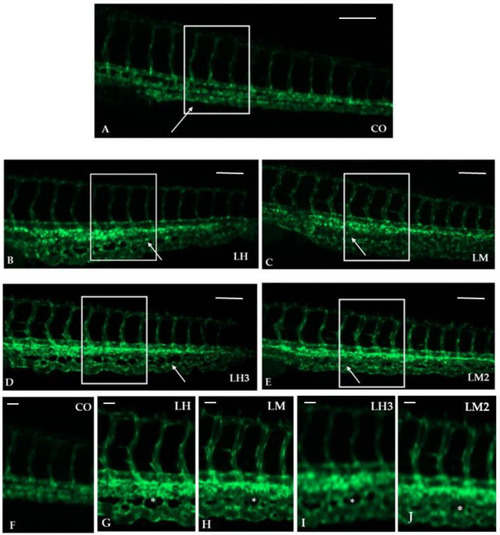
Purified extracts from |

The graphs represent the mean values obtained for ISV length ( |
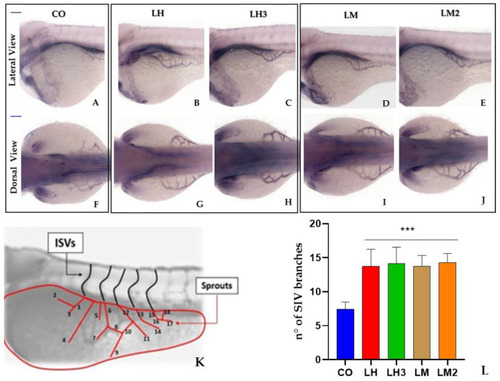
Purified extracts from |
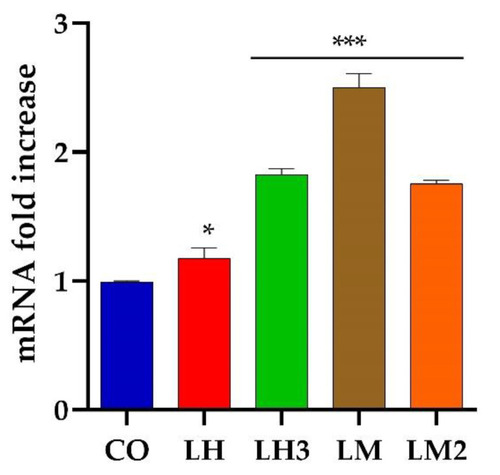
Expression level analysis of |
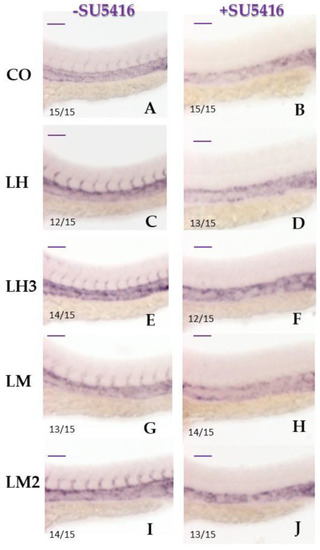
Pretreatment with a VEGF pathway inhibitor prevented the formation of intersomitic vessels: The panels show representative images of a WISH assay performed with |